By Philippe Favreau
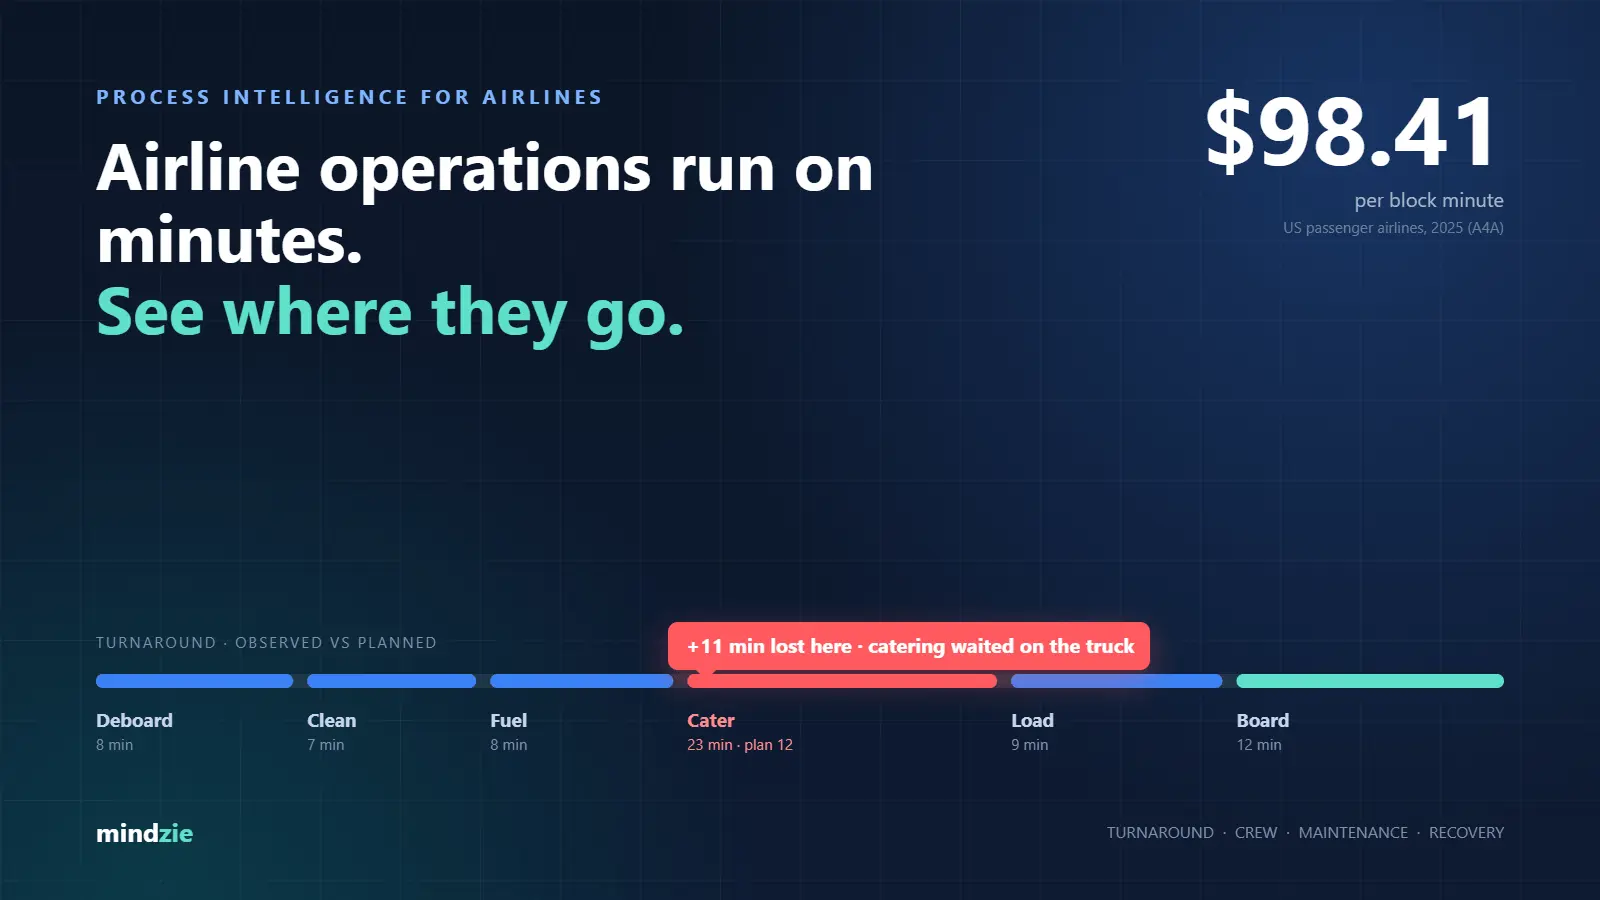
In 2025, one minute of aircraft block time cost a US passenger airline an average of $98.41: $37.01 in crew, $29.34 in fuel, $18.35 in maintenance, $9.76 in aircraft ownership, and $3.95 in everything else, according to Airlines for America’s analysis of US passenger carrier delay costs. Everything in an airline’s operation is ultimately priced in minutes. The hard part is knowing which minutes, lost where, and why.
That question is what process intelligence answers. Not another dashboard of on-time performance. A diagnosis of the operation as it actually runs, gate by gate and shift by shift.
The cascade: why one late turn is never just one late turn
Every operations controller knows the scene. The first rotation of the morning pushes back ten minutes late because boarding started late. Nobody panics. The aircraft is scheduled tightly for the rest of the day, though, so the delay is carried forward into rotation two, and the buffer that was meant to absorb something else is already spent. By the afternoon, the same tail is late at a station that did nothing wrong, and a crew is approaching its duty limit.
Delay compounds downstream. That is why the cheapest minute to recover is the first one, and why the average on-time figure for a network hides more than it shows. The average tells you that you were late. It does not tell you which step, at which station, with which handler, on which shift, made you late.
Where the minutes go: plan against reality
A turnaround is planned as a clean sequence: deboard, clean, fuel, cater, load, board. In practice those steps overlap, wait on each other, and wait on people and equipment that are somewhere else. The plan lives in a standard. The reality lives in timestamps scattered across the airport operational database, the crew system, the baggage system, and the maintenance record.
Your systems already wrote it all down. Process intelligence reconstructs every turn from that event data, compares what was planned with what happened, and names the step where time was actually lost. The observed operation, not the documented one, becomes the thing you manage.
Six operations, one event log
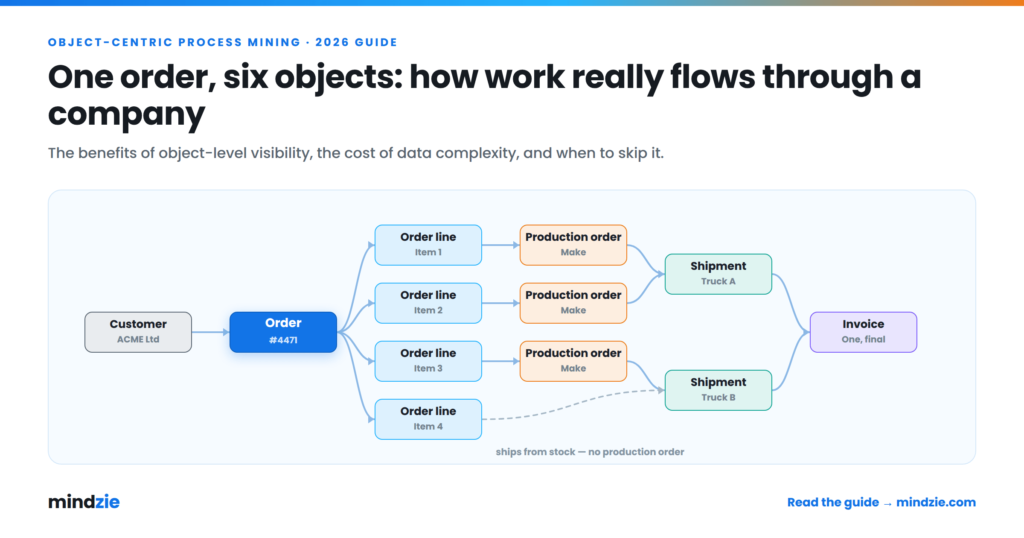
Airline processes are not independent. A late bag holds a door. A deferred defect grounds a tail. A disruption decision reshuffles crews across the network. mindzie connects them in a single object-centric event log, so a flight, an aircraft, a crew pairing, a bag, and a work order can be followed together rather than in separate reports. The scope covers:
- Turnaround: chocks on to chocks off, step by step.
- Crew: pairing, duty time, and how standby crews are actually used.
- Disruption: recovery decisions and what each one cost.
- Baggage: check-in to belt to load.
- Maintenance: defect to release to service.
- On-time performance: root cause by station, not just a percentage.
Because discovery runs on the raw event logs, there are no workshops and no sampling. Every flight is analyzed, every day, rather than a sample someone had time to review.
The analysis writes itself, every week
Operations teams do not need more charts to decode. mindzie generates AI insight reports that follow the same four questions an experienced duty manager would ask:
- What happened, stated plainly.
- Why it happened, traced to the step, station, and shift.
- What to do, as a specific change with an owner.
- What it is worth, with the cost impact quantified before anyone commits.
Root cause analysis identifies which attributes statistically drive a bottleneck, so the recommendation points at a cause rather than a symptom. Real-time monitoring flags stuck cases and SLA risks as they develop, with alerts sent to Microsoft Teams, Slack, or email. The report is generated automatically. The decision stays with your people.
Why airline data has to stay on premise
This is the part of the conversation that most process mining vendors would rather skip. The data that explains an airline’s operation is exactly the data an airline should be least willing to send to someone else’s cloud.
Crew records are personal data: names, rosters, duty and rest histories, qualifications, sometimes medical status. Passenger and baggage events can be tied to individuals. Maintenance records carry airworthiness and safety significance. Flight operations data reveals network strategy that competitors would value. And airlines operate across jurisdictions whose data protection laws, from GDPR in Europe to the PDPL in Saudi Arabia and the PIPL in China, place conditions on moving personal data across borders. For a carrier flying into dozens of countries, “where does this data go, and who can process it” is a question the legal, security, and data protection teams will ask before any analysis starts.
The same question now applies to AI. Sending flight and crew data to a hosted large language model to generate insights moves that data, and the prompts and answers built from it, outside your control.
mindzie’s on-premise deployment runs the full platform inside your firewall, with AI models running locally. Your systems, mindzie, and your own LLM sit in your data center, alongside the flight and crew data, the models, the prompts, and the answers. Cloud and desktop editions offer the same features, so the deployment follows your security requirements… not the vendor’s preference. For an airline, data sovereignty is not a checkbox. It is a precondition for doing the analysis at all.
Context your AI agents can act on
Airlines are starting to put AI agents into disruption handling, crew support, and maintenance planning. Give an agent only a list of steps and it fills every gap with plausible invention. In an operation governed by duty limits, safety rules, and regulatory constraints, plausible invention is a liability.
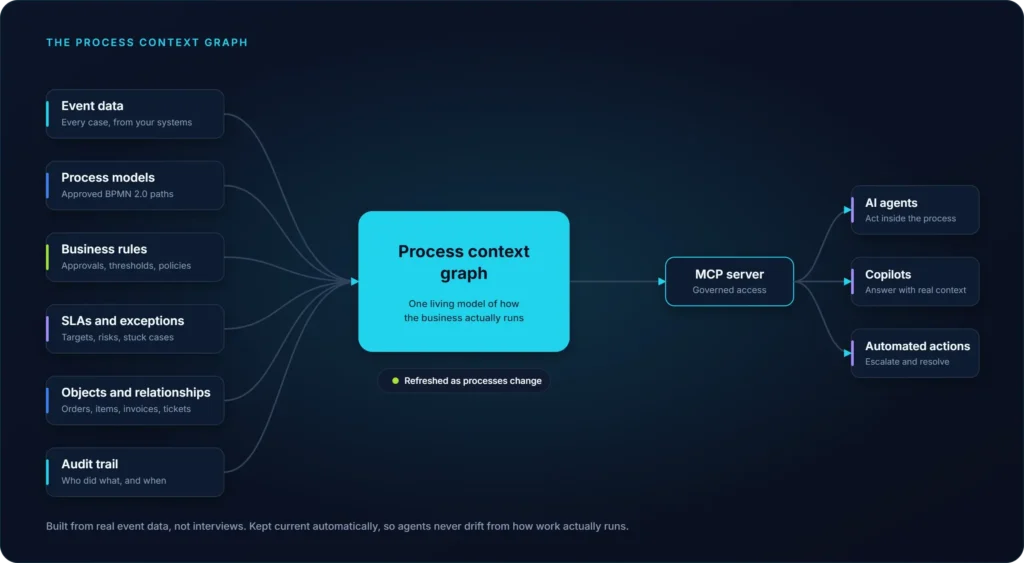
mindzie derives a Process Context Graph from the observed operation: nine dimensions, including objectives, success criteria, decision rules, allowed variants, policies, exceptions, and escalations, exported as one machine-readable file and exposed to your agents through an MCP server. The agent works inside the rules your best people already follow, and hands over when it should. Because the graph is refreshed from the event log on a schedule, it stays current as the operation changes. Context does not make a model smarter. It makes an agent trustworthy.
One station, one quarter, one result
You do not need a network-wide program to find out whether this works. Start small and let the evidence make the case:
- Weeks 1 to 4, prove: connect one station and agree on the turnaround as it actually runs.
- Weeks 5 to 8, quantify: minutes and money per step, with a baseline agreed with finance.
- Weeks 9 to 12, deliver: change what the evidence points at and measure the movement.
- Quarter 2 onward, scale: more stations, then context graphs for your agents.
At $98.41 a block minute, the minutes are too expensive to manage from memory. Run the operation on evidence instead, inside your own perimeter.
See how mindzie runs on premise, or contact us at info@mindzie.com to scope a one-station pilot.
Source: Airlines for America, U.S. Passenger Carrier Delay Costs, 2025 data.