mindzie logo - 150x50px
  • Products
    Intelligence Suite
    BPMN Modeling Software
    Process Mining
    Process Mining (On-Premises)
    Task Mining
    Data Designer (Log Creation)
    Modules
    AI Process Intelligence Copilot
    Automated Action Engine
    Operational Intelligence
    Python and Process Mining
    Process Mining – Services
  • Use Cases
    Department
    Compliance and Audit
    Finance
    IT Service Management
    Order to Cash
    Procure to Pay
    Industry
    Banking
    Health Care
    Insurance
    Manufacturing
    Process Improvement
    Utilities
  • Consultants
  • Resources
    Helpful Links
    Blog
    Online Training Portal
    Just Learning?
    What is Process Mining?
    Academic Process Mining License
    E-Book: Unlocking Enterprise Value with Process Mining & Intelligence
    EBook: Process Mining for Business Analysts
    EBook: Audit Log Recipe
  • Company
    About Us
    Careers
    Contact Us
  • EN
    AR
    ES
    PT
    TR
Book Demo
Free Download
mindzie logo - 150x50px
Book Demo
  • Products
    Intelligence Suite
    BPMN Modeling Software
    Process Mining
    Process Mining (On-Premises)
    Task Mining
    Data Designer (Log Creation)
    Modules
    AI Process Intelligence Copilot
    Automated Action Engine
    Operational Intelligence
    Python and Process Mining
    Process Mining – Services
  • Use Cases
    Department
    Compliance and Audit
    Finance
    IT Service Management
    Order to Cash
    Procure to Pay
    Industry
    Banking
    Health Care
    Insurance
    Manufacturing
    Process Improvement
    Utilities
  • Consultants
  • Resources
    Helpful Links
    Blog
    Online Training Portal
    Just Learning?
    What is Process Mining?
    Academic Process Mining License
    E-Book: Unlocking Enterprise Value with Process Mining & Intelligence
    EBook: Process Mining for Business Analysts
    EBook: Audit Log Recipe
  • Company
    About Us
    Careers
    Contact Us
  • EN
    AR
    ES
    PT
    TR

Getting Started

7
  • Load Dataset
  • Create Investigation
  • Create Analysis
  • Add Filter
  • Add Calculator
  • Add Log Enrichment
  • Create Dashboard

Frequency Filters

4
  • Value Frequency
  • Activity Performed Once
  • Activity Not Performed
  • Selected Activity Frequency

Overview

8
  • Case Explorer
  • Process Map
  • Resource Performance vs Conformance
  • Dataset Information
  • Process Performance Matrix
  • Data Selector
  • Export Image (Process Map and Dashboard)
  • Full screen Process Map

Time Filters

1
  • Time Period

Duration Filters

1
  • Deadline

Order Filters

3
  • Process Variants
  • Event Order
  • Case End

AI Calculators

2
  • Automation
  • Root Cause Analysis

Attribute Calculators

9
  • Average Value
  • Breakdown by Categories
  • Sum of Values
  • Sum of Values for Activity
  • Trend
  • Minimum Value
  • Maximum Value
  • Selected Cases by Category
  • Duplicate Cases

Frequency Calculators

7
  • Rate
  • Value Count in Case Attribute
  • Value Count in Event Attribute
  • Histogram
  • Repeated Activities
  • Activity Information
  • Case Count

Time Calculators

4
  • Selected Cases by Category Over Time
  • Selected Cases Over Time
  • Rate Over Time
  • Time Between All Activity Pairs

Duration Calculators

3
  • Case Duration
  • Time From Case Start to Selected Event
  • Time Between Selected Events

Advanced Calculators

1
  • What-If Simulation: Working Capital

Conformance Enrichments

4
  • Allowed Case Start Activities
  • Wrong Activity Order
  • Repeated Activity
  • Allowed Case End Activities

Attribute Enrichments

10
  • Events with Attribute
  • Cases with Attribute
  • Duration Between Two Activities
  • Duration Between an Attribute and an Activity
  • Representative Case Attribute
  • Multiply
  • Subtract
  • Divide
  • Case Closed
  • Cases with Changed Attribute

Sample Datasets

1
  • Sample Datasets

Datasets

1
  • Update Dataset from CSV
  • Home
  • Docs
  • mindzie studio Help
  • Calculators
  • Attribute Calculators
  • Breakdown by Categories
View Categories

Breakdown by Categories

Overview #

The calculator is used to break down data by selected categories (e.g., Customer or Vendor).

Common Uses #

  • Identify top customers by total invoice value.
  • See the number of activities performed by different resources.
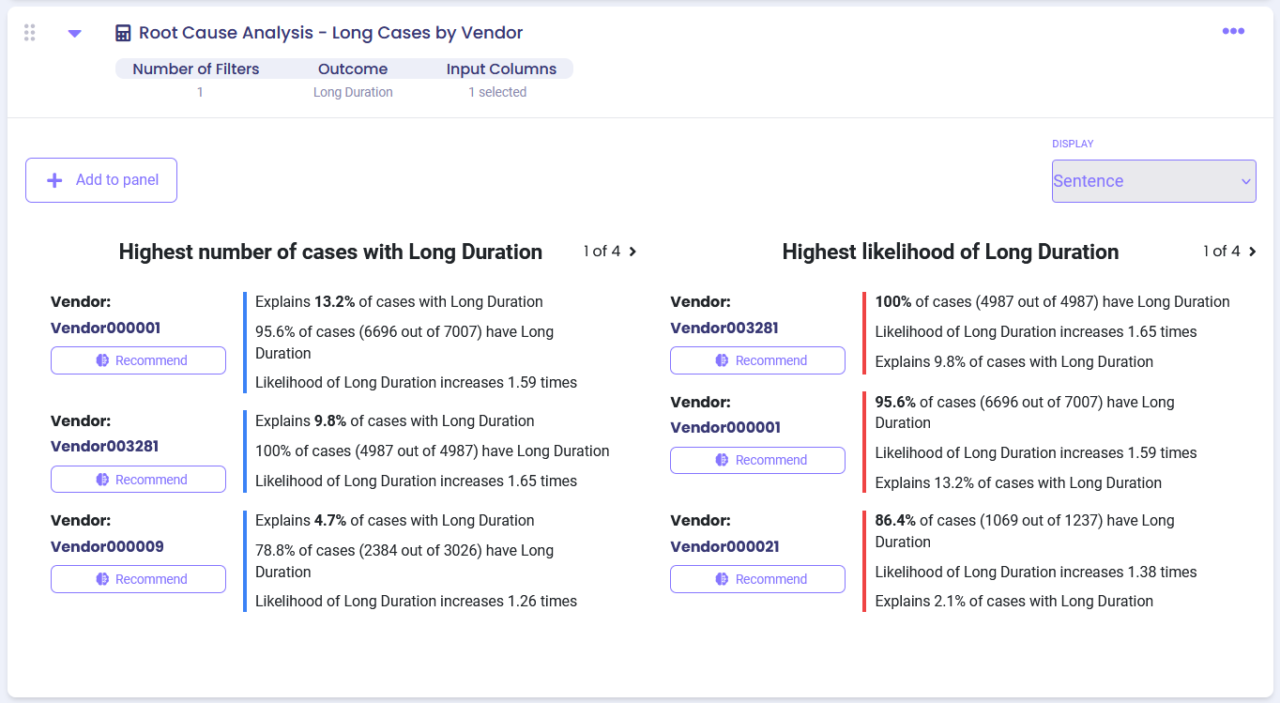
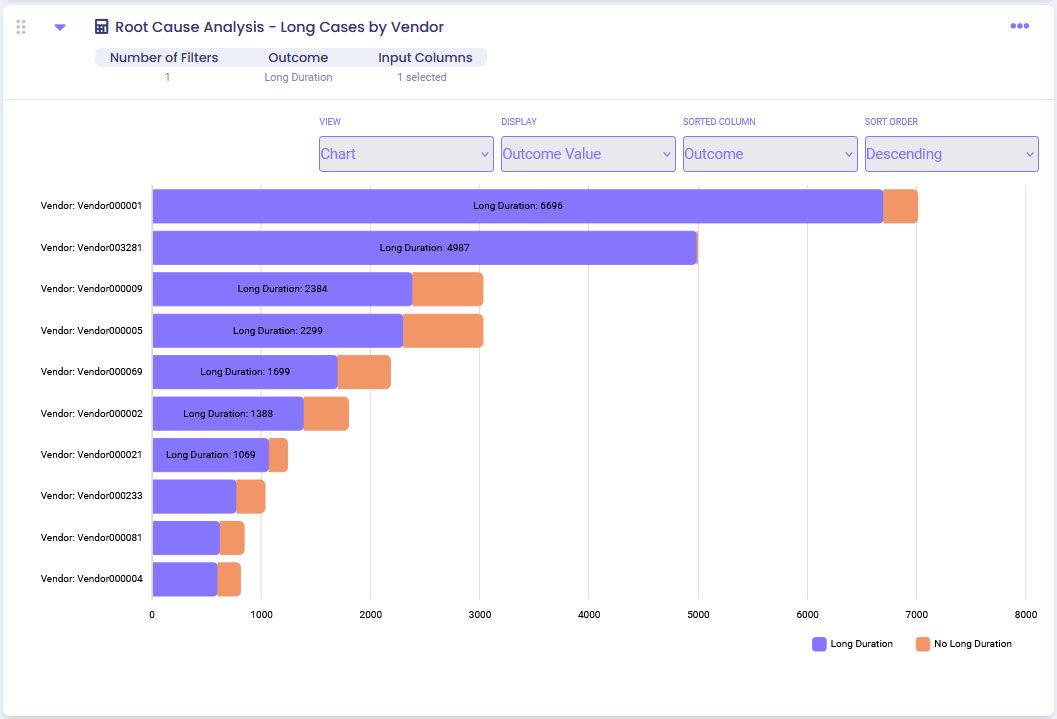
  • Identify the number of late deliveries by vendor
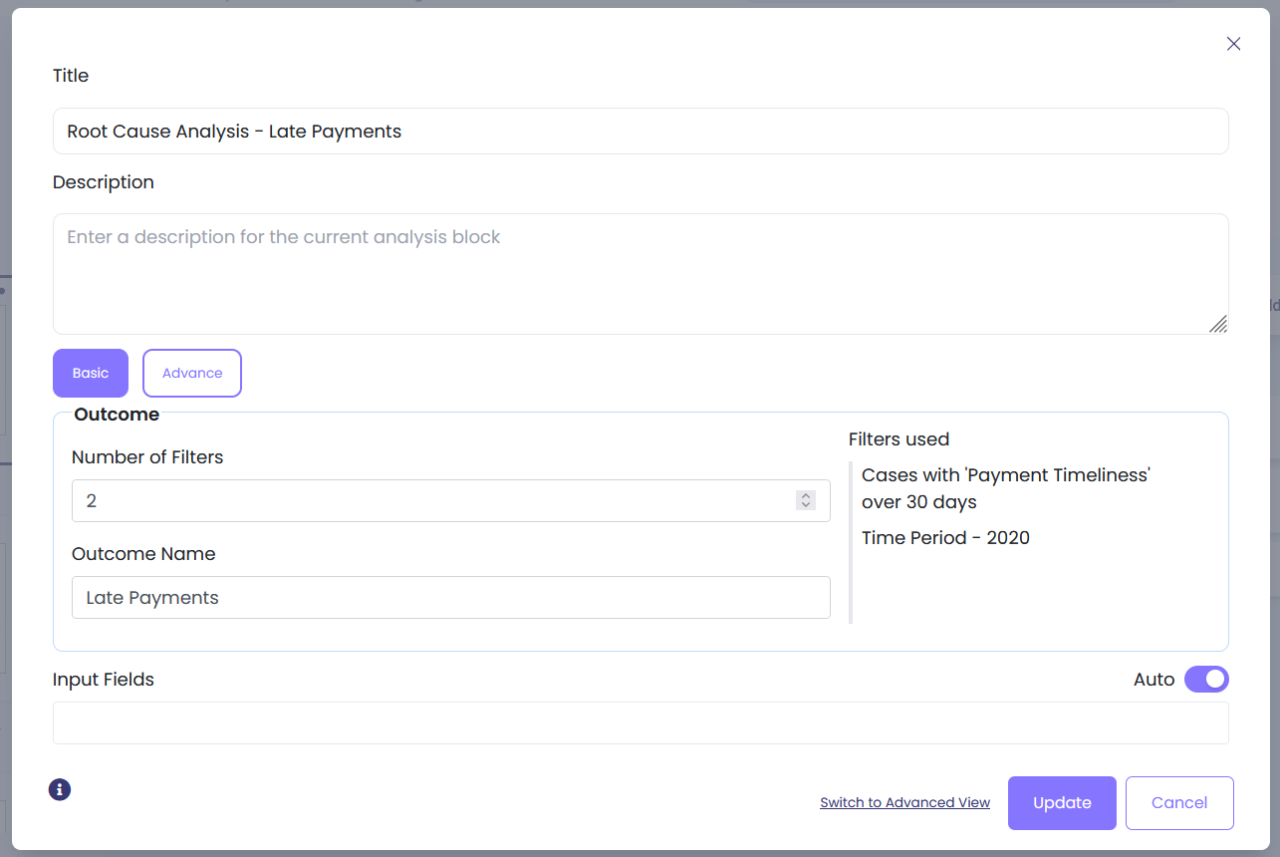
Settings #

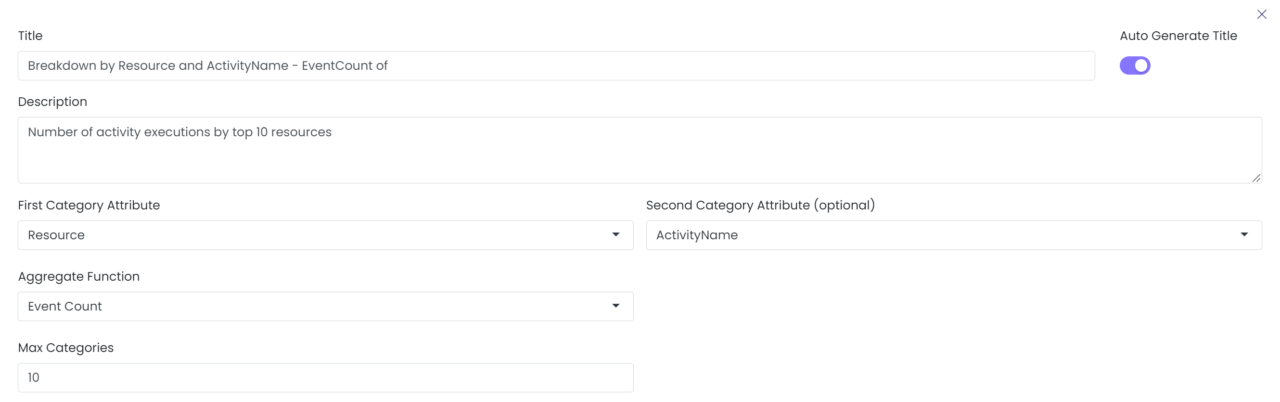
  • First Category Attribute: Select the first categorical attribute you would like to use in the breakdown (e.g., select ‘Resource’ if you wish to learn how many activities each resource performed).
  • Second Category Attribute (optional): You can select an additional categorical attribute.
    • For example, if you wish to check specific activities performed by each resource, you should select ‘Resource’ as the First Category Attribute and ‘Activity Name’ as the Second Category Attribute.
  • Aggregate Function: Select how you would like to aggregate the data.
    • For example, to learn how many cases are processed by different resources you should select ‘Case Count’; to learn how many activities are performed by different resources you should select ‘Event Count’.
  • Value Attribute: For certain values of ‘Aggregate Function’ (e.g., for ‘Sum’ or ‘Average’) you need to select a data attribute you are interested in.
    • For example, if you wish to check average case duration by customer, you should select ‘Customer’ as the First Category Attribute, ‘Average’ as Aggregate Function and ‘Case Duration’ as Value Attribute.
  • Max Categories: Specify the maximum number of categories that will be shown in the output.
    • For example, you can set the value to 10 if you are only interested in top 10 customers.
  • Category Ordering: Specify whether the values will be ordered in a descending or an ascending order.
    • For example, if you wish to see resources with the maximum number of activity executions on top, you should select ‘Descending’.
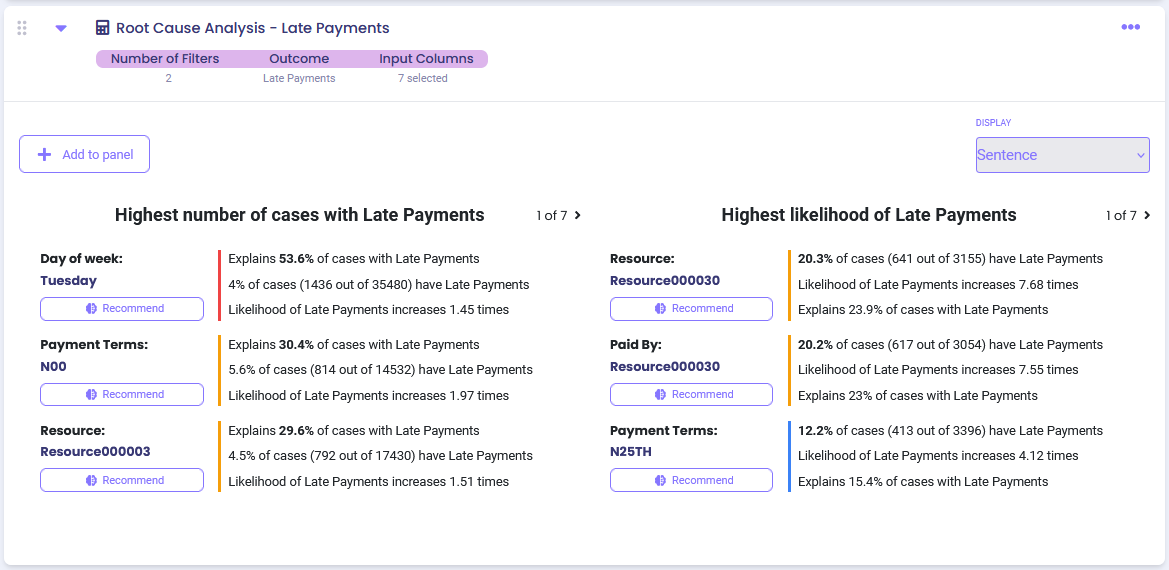
Examples #

Example 1 #

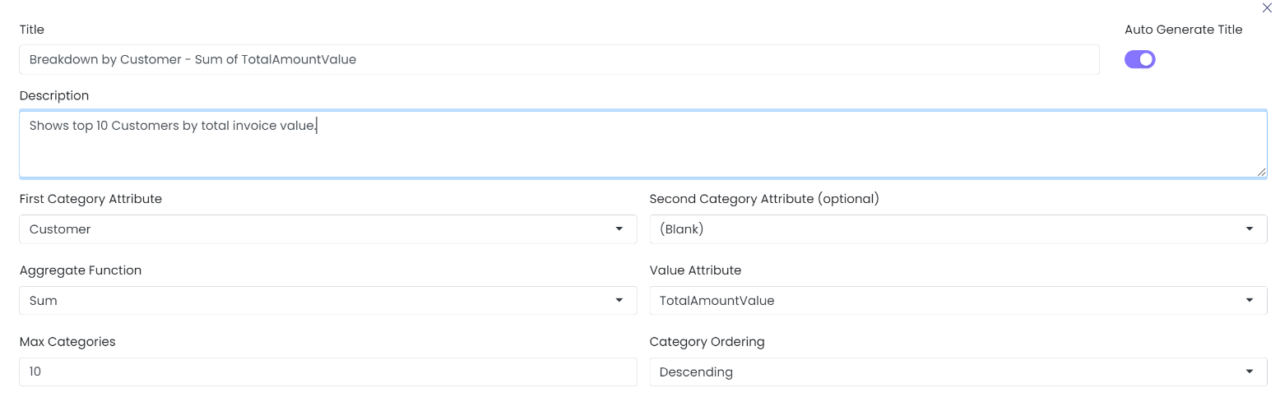
To see top 10 Customers by total invoice value, use the following settings:

Output options:

1. Grid (default output)

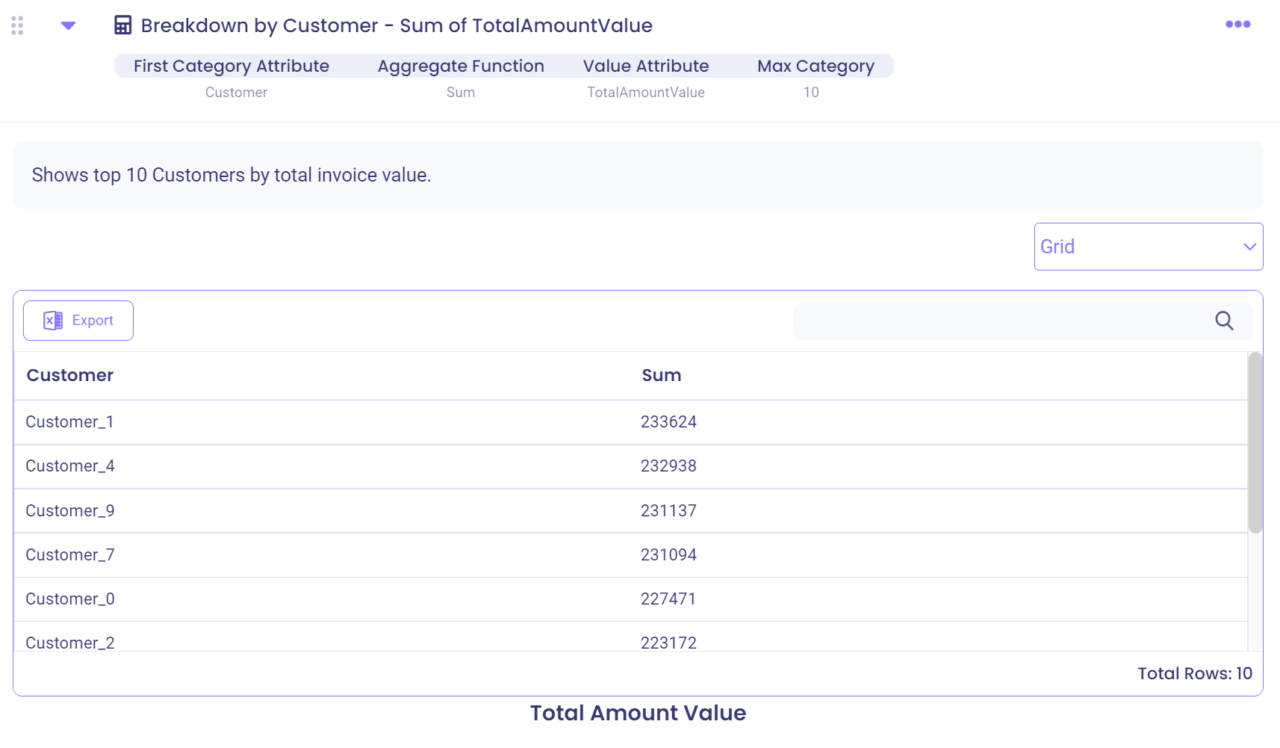
Click on a Customer name to see data for the selected Customer.

2. Horizontal bar chart (select from the dropdown list in the top right corner)

3. Pie chart (select from the dropdown list in the top right corner)

Example 2 #

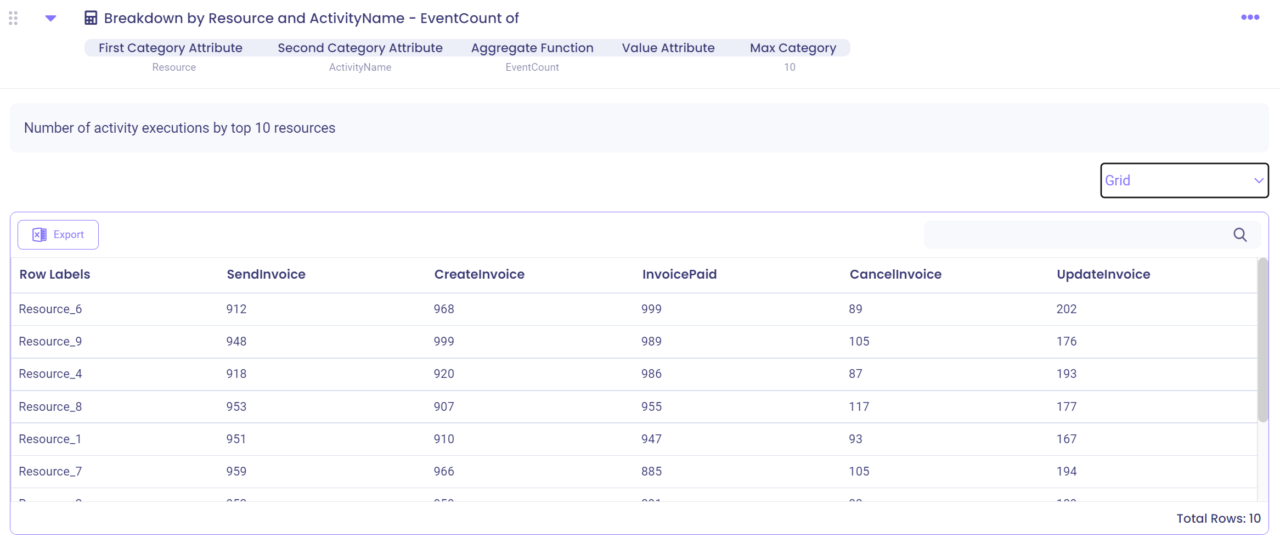
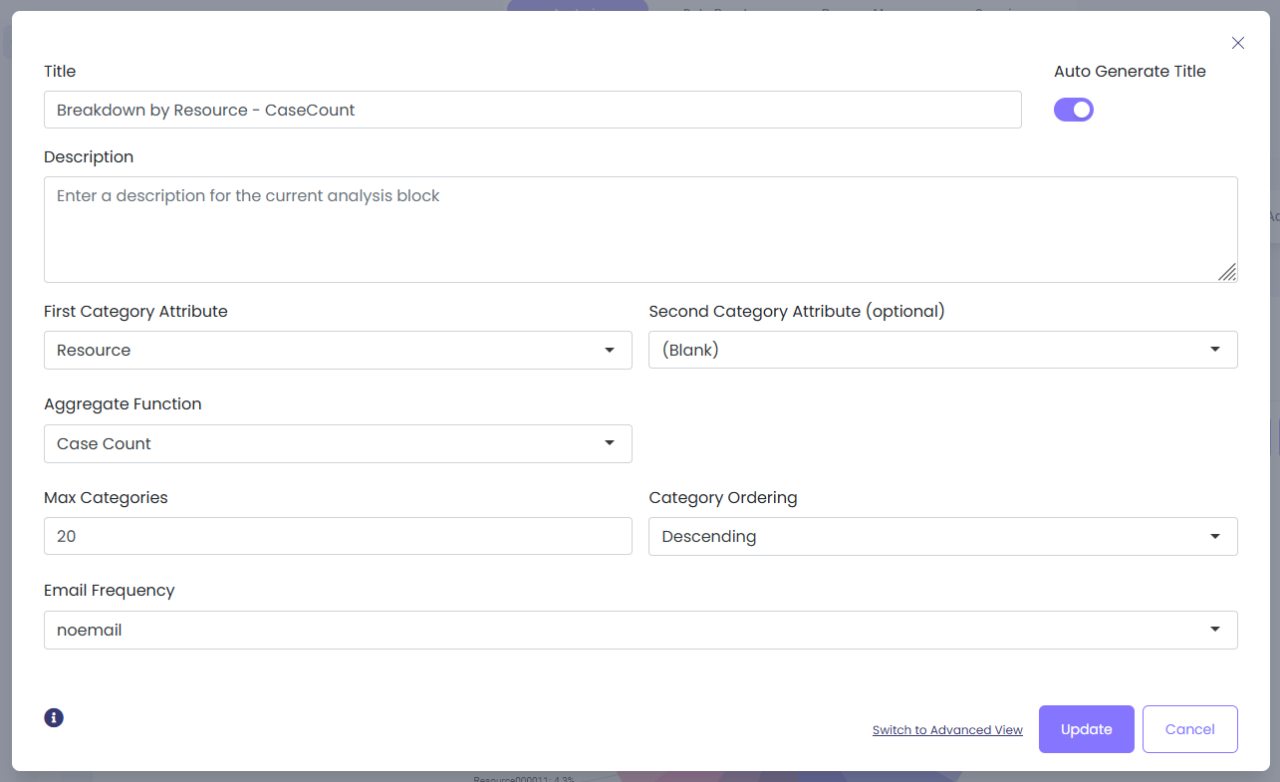
To see the number of executions of different activities by top 10 resources, use the following settings:

Output options:

1. Tree map (default output)

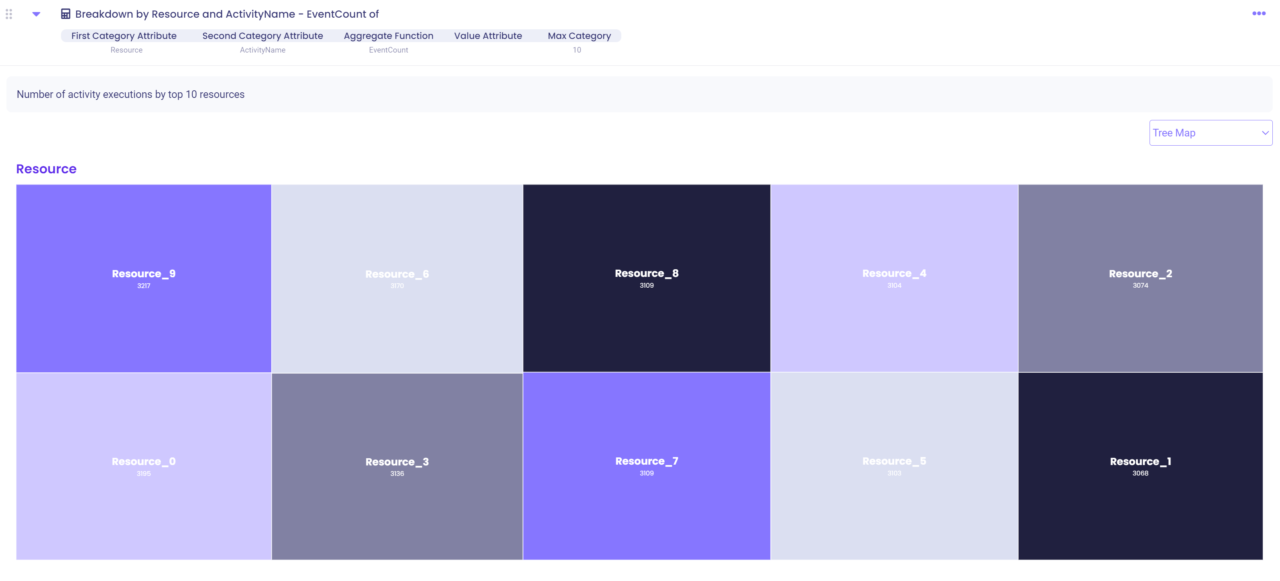
To see activities performed by a specific resource, click on the resource, e.g., output for Resource_9:

2. Vertical grid (select from the dropdown list in the top right corner)

3. Grid (select from the dropdown list in the top right corner)

Still stuck? How can we help?

Still stuck? How can we help?

Average ValueSum of Values
Table of Contents
  • Overview
  • Common Uses
  • Settings
  • Examples
    • Example 1
    • Example 2
Image link

Our AI-Driven Process Intelligence Platform with Automated Actions and out of the box connectors is helping transform organizations across the globe.

Contact Us

Quick Links

HomeBook a DemoConsultantsBlogFree Download

Products

BPMN ModelingProcess MiningTask MiningData Designer

Resources

TrainingHelp Center

Company

About UsCareersPrivacy Policy

Image link

© 2025 mindzie. All rights reserved. This website uses remarketing to advertise on third party websites. You can opt out at any time by changing cookie settings.