Overview #
The calculator shows how a selected process property changes over time.
Common Uses #
- See the number of open cases change over time.
- See the number of cancelled invoices change over time.
- See the value of opened invoices over time.
- See the timeliness of shipments change over time.
Settings #
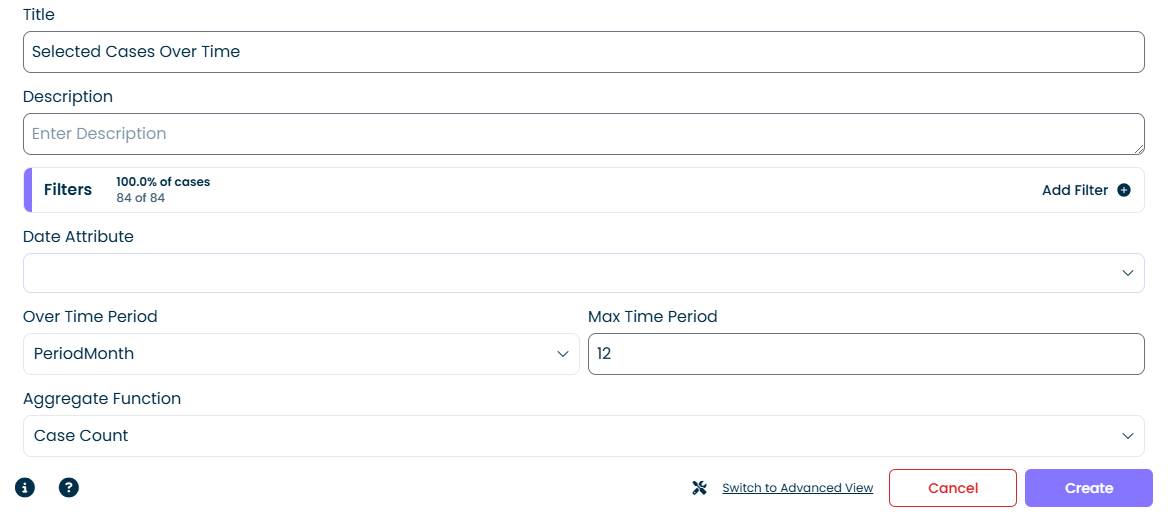
- Filters: Filter the data that you wish to use in the calculator analysis.
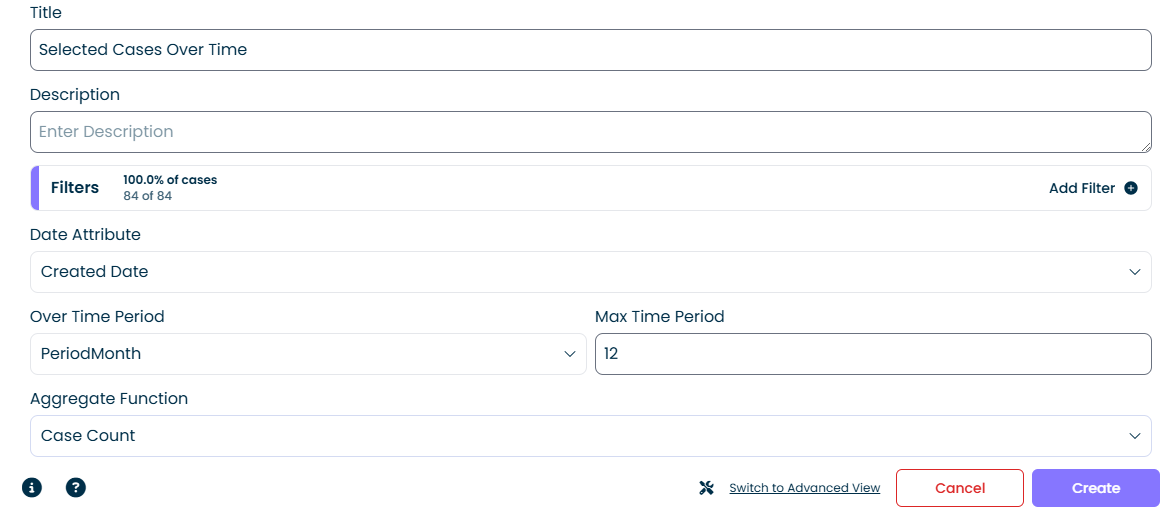
- Date Attribute: Select the attribute that best represents the timestamp of the property you wish to analyse. This timestamp defines how each case will be selected and placed into a time period (e.g.: “Case Start†will select cases based on the date they started and place them into the corresponding time period; “ActivityTime†will select cases based on the start of the activity that is chosen in the next step).
- Over Time Period:Select the time period (e.g., whether you want to see daily, weekly or monthly values). Number of cases will be counted for each period.
- Max Time Period: Specify the maximum number of periods to use in the calculation (e.g., past 12 months).
- Aggregate Function: Select how to aggregate the data for each time period.
- Value Attribute: Specify the attribute to use for aggregation (e.g.: Item Cost, Item Quantity, etc)
| Aggregate Function | Description |
| Average | Returns the average of the selected attribute in each period. |
| Case Count | Returns the number of cases present in each period. |
| Max | Returns the maximum value of the selected attribute in each period. |
| Min | Returns the minimum value of the selected attribute in each period. |
| Sum | Returns the sum of the selected attribute in each period. |
Examples #
Example 1 #
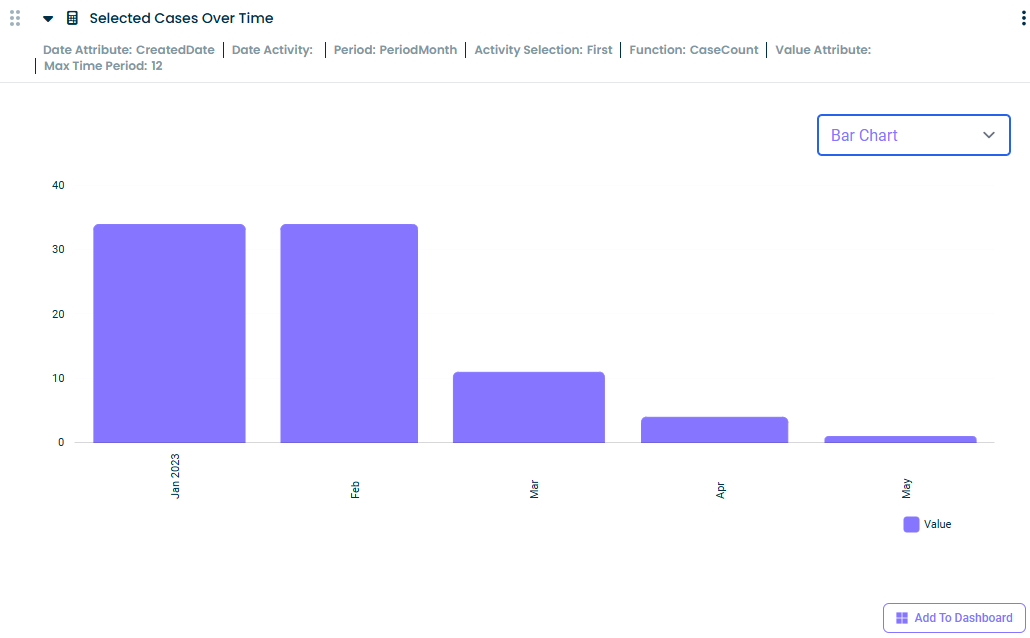
To analyze the number of started cases in each month, use the following settings:
Output options:
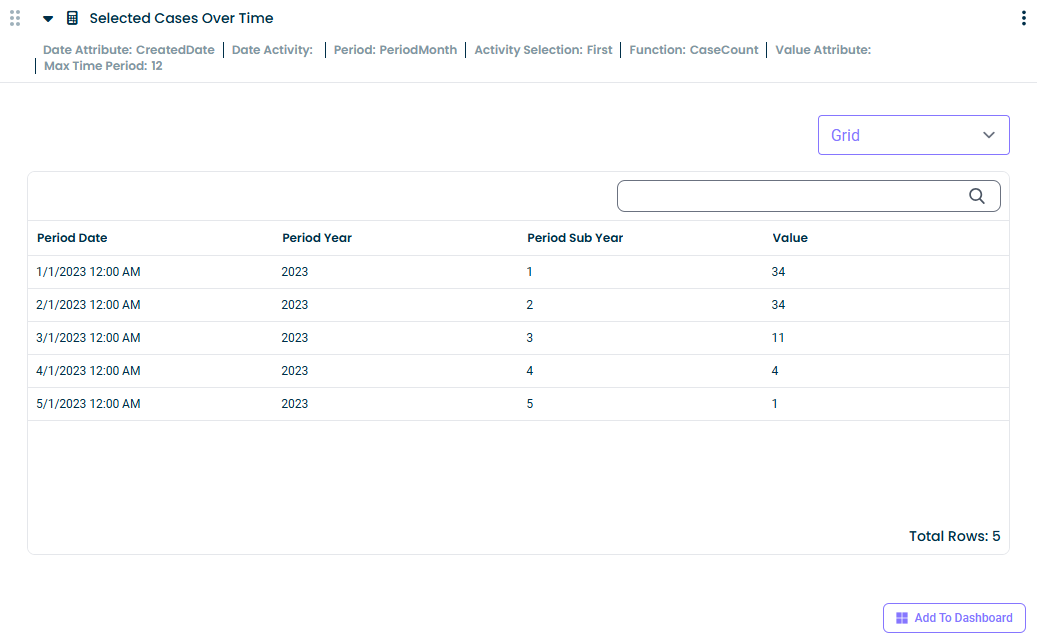
1. Grid (default)
2. Line Chart
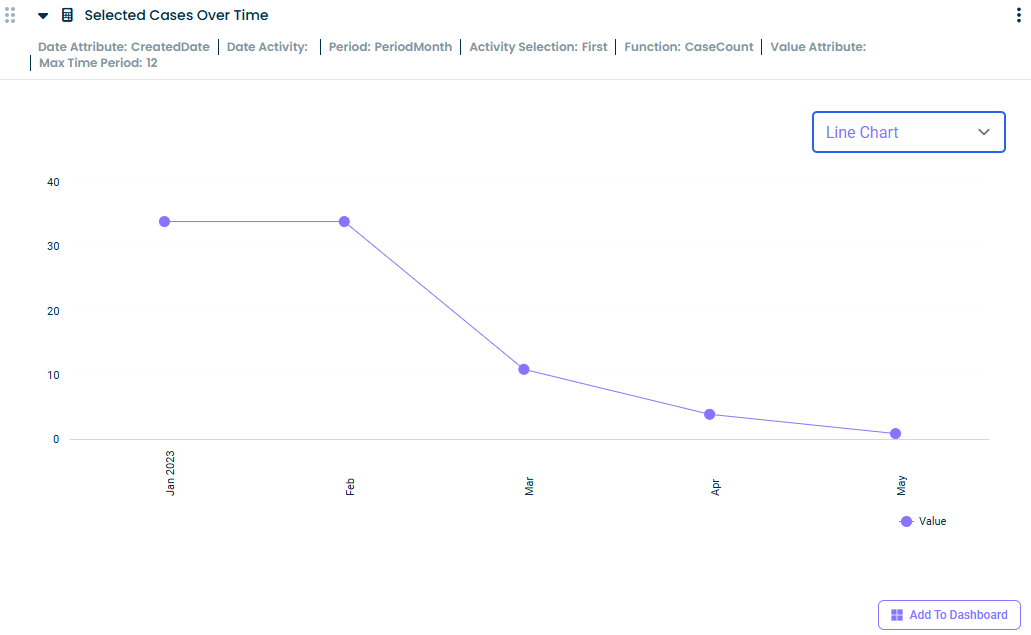
3. Bar Chart