Overview #
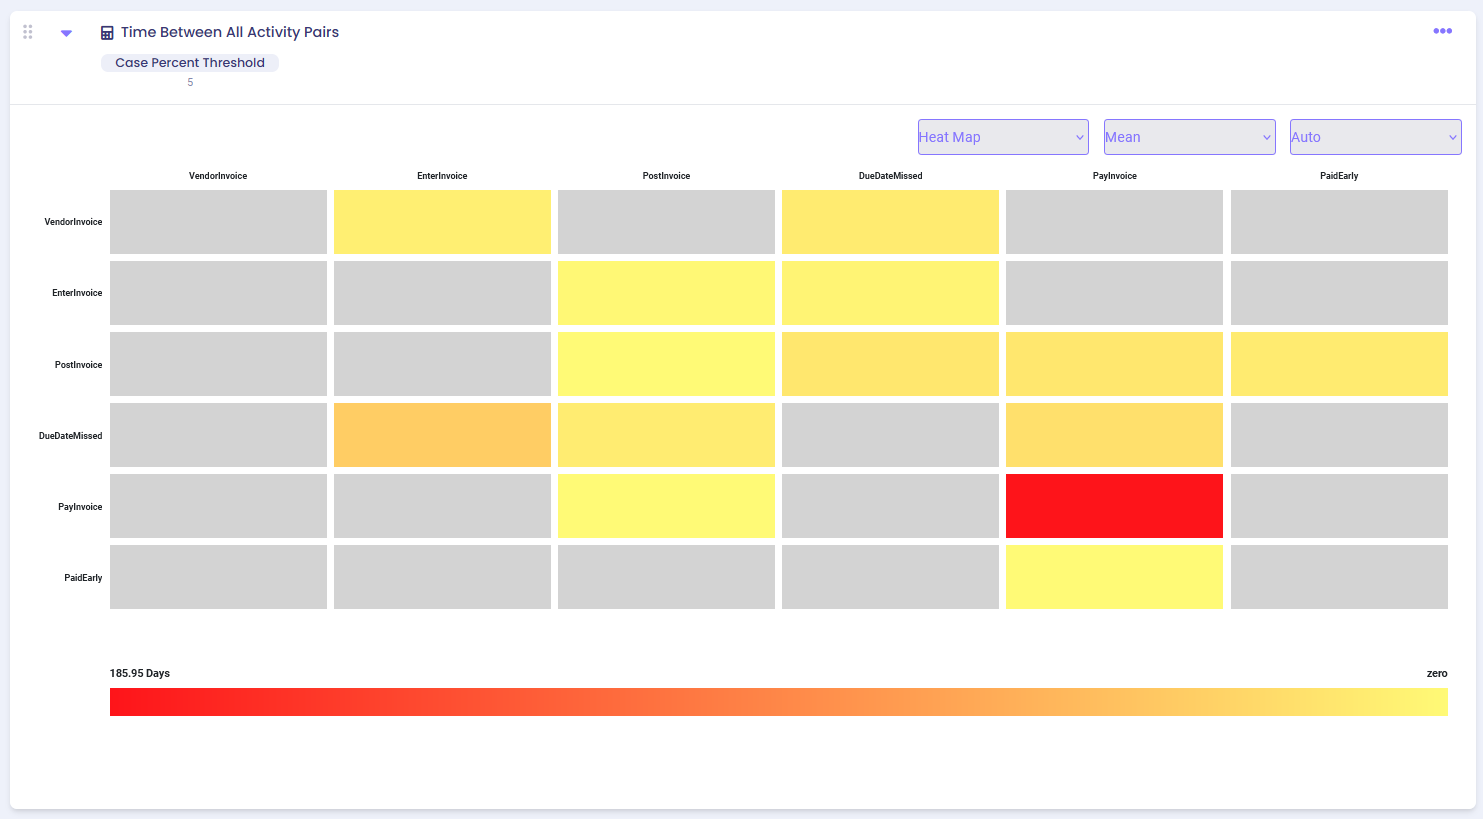
The calculator shows information about the time between all activity pairs in the process.
Common Uses #
- See the duration between all process activities.
- Find bottlenecks between process activities.
Settings #
Case Percent Threshold: Specify the minimum percent of cases in which an activity pair occurred for the pair to be included. For example, if you specify ’20’ only activity pairs where one activity directly follows another activity in at least 20% of cases will be included in the output. The setting helps to filter out activity pairs that happen rarely.
Examples #
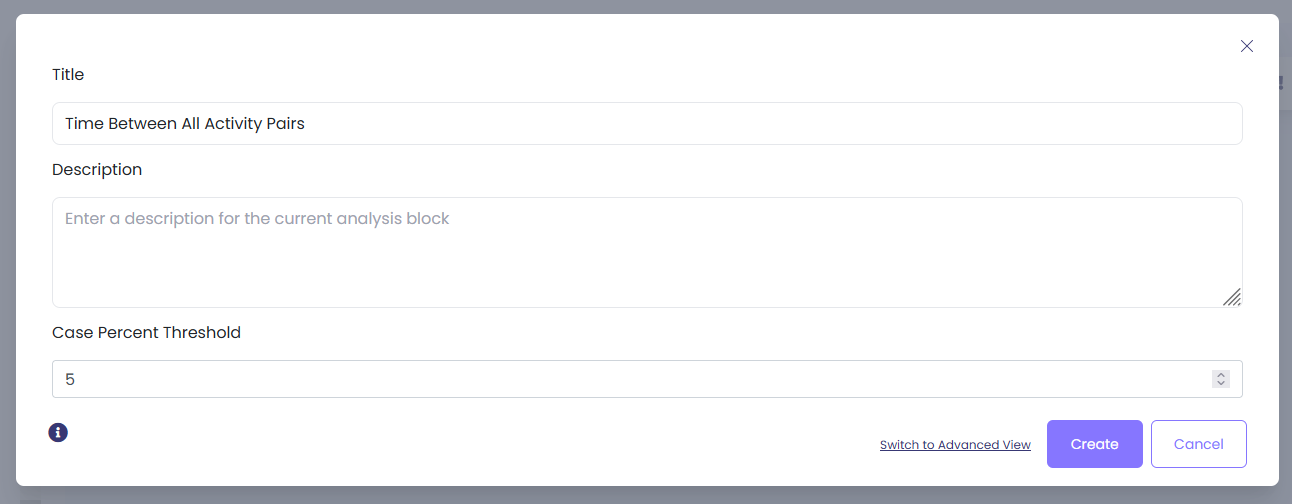
To see the duration between activity pairs that happen in at least 5% of cases, use the following settings:
Heatmap output:
Output options:
| Grid | The grid displays time between activities in a tabular format. The option is best used for sorting on different values depending on the need. |
| Heatmap | The heatmap displays a visual representation of the duration between each activity pair. Red-yellow scale represents the total duration. Gray represents activity pairs with no directly follows relationship (or with a low frequency which falls below the threshold). |
| Matrix | The matrix displays the same information as the heatmap but in a tabular format. The option is best used for exporting data in a matrix format. |
Output settings:
| Mean | Displays the mean duration between activities. |
| Median | Displays the median duration between activities. |
| Max | Displays the maximum duration between activities. |
| Sum | Displays the sum of durations between activities. |
| Stdev | Displays the standard deviation of durations between activities. |
| MAD | Displays the median absolute deviation of durations between activities. |