Overview #
The calculator is used to break down data by selected categories (e.g., Customer or Vendor).
Common Uses #
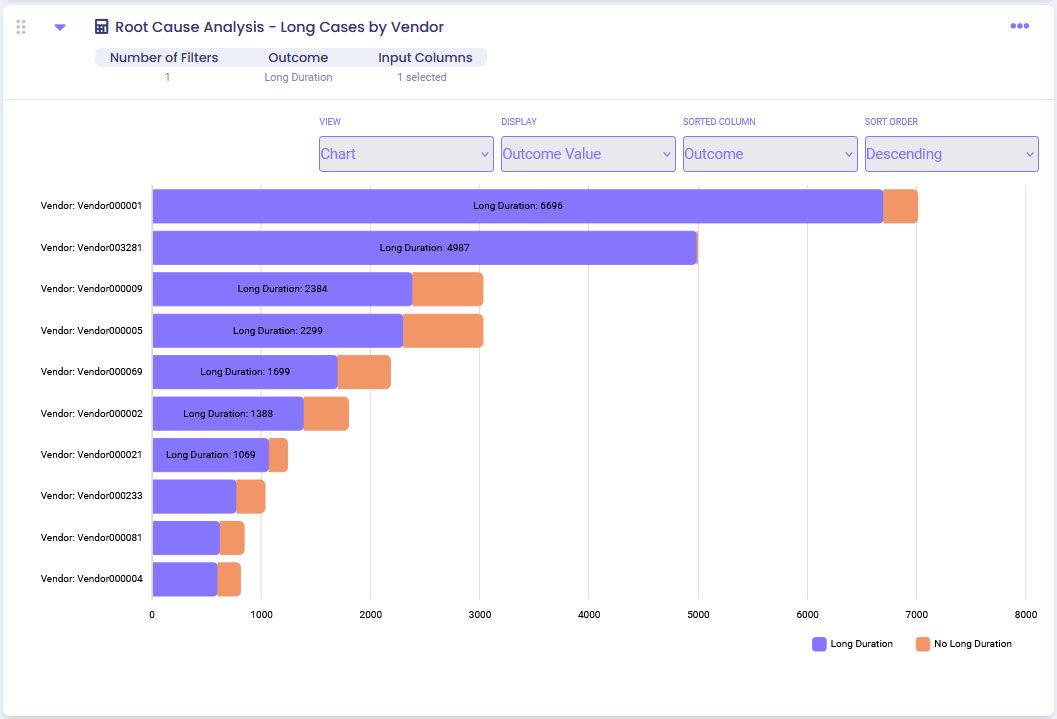
- Identify top customers by total invoice value.
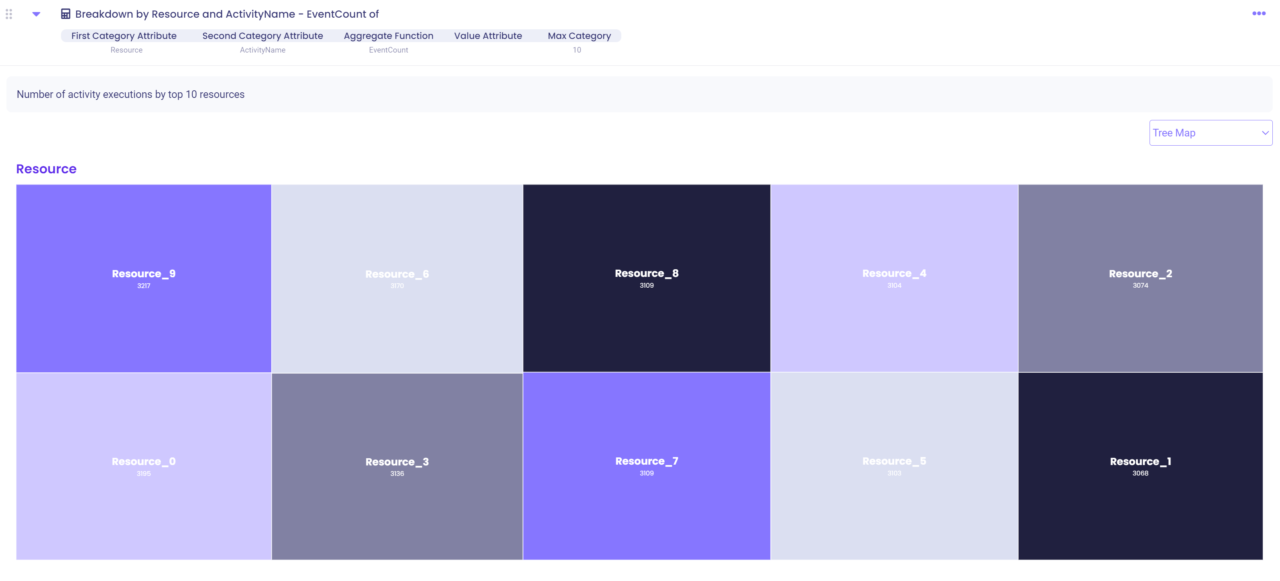
- See the number of activities performed by different resources.
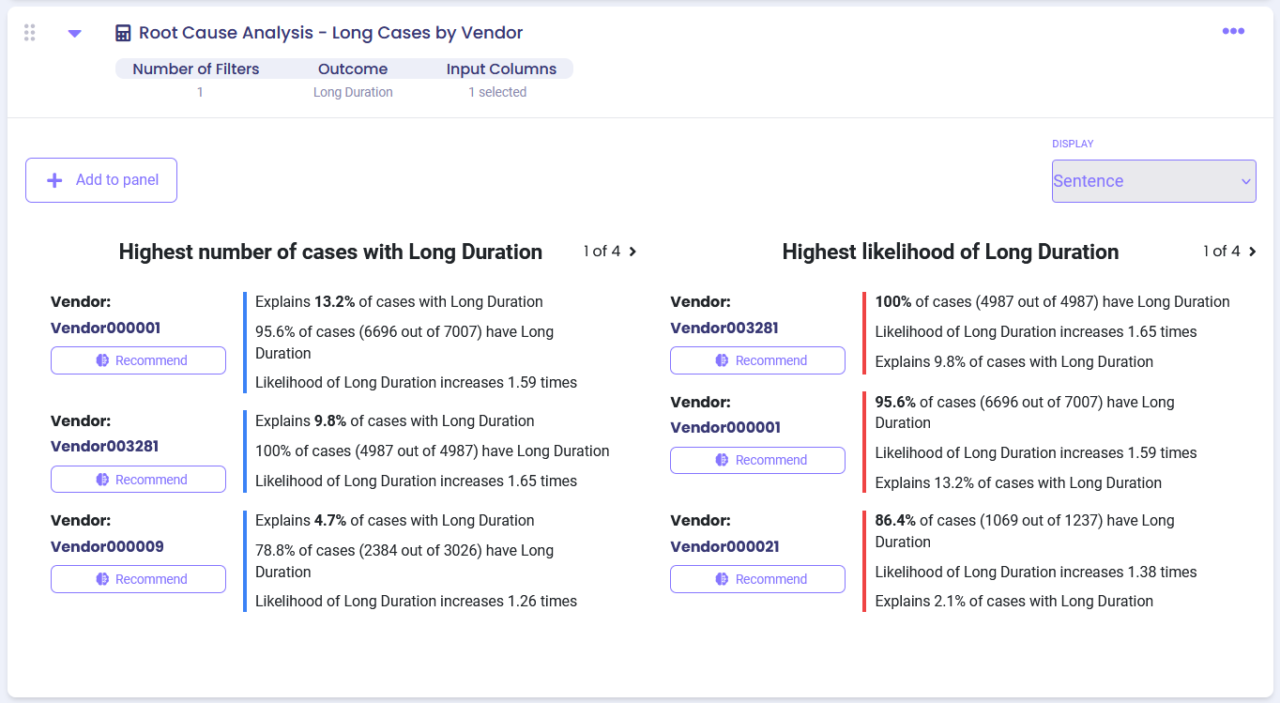
- Identify the number of late deliveries by vendor
Settings #
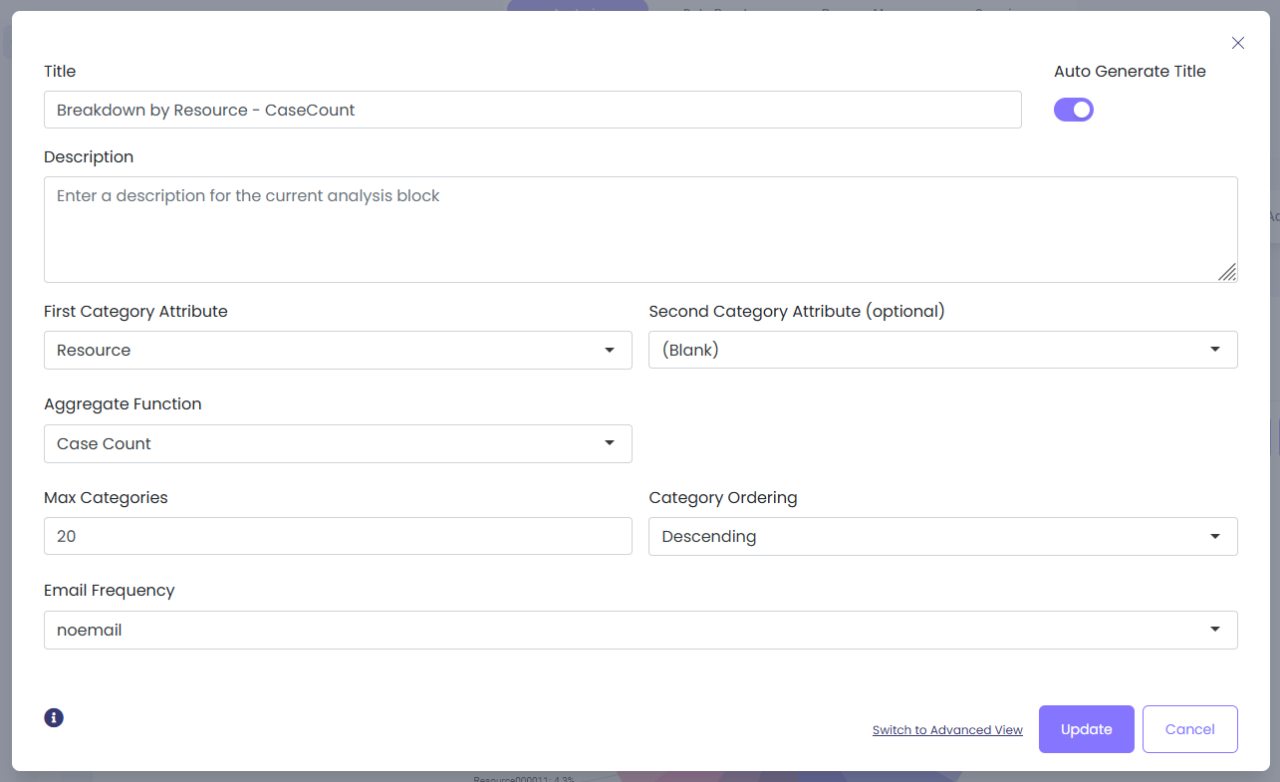
- First Category Attribute: Select the first categorical attribute you would like to use in the breakdown (e.g., select ‘Resource’ if you wish to learn how many activities each resource performed).
- Second Category Attribute (optional): You can select an additional categorical attribute.
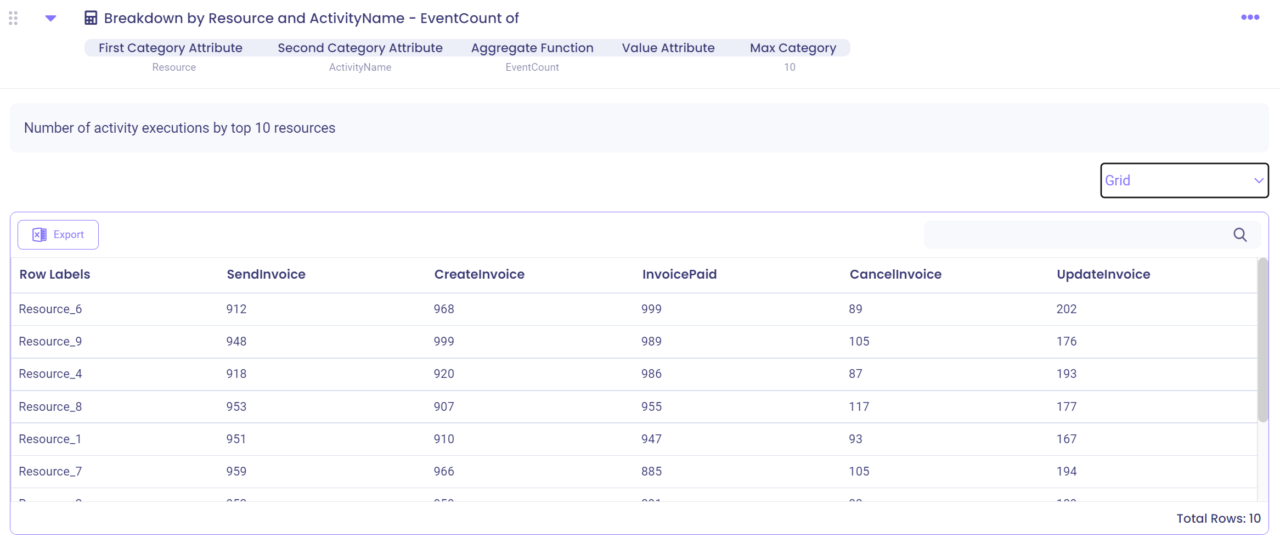
- For example, if you wish to check specific activities performed by each resource, you should select ‘Resource’ as the First Category Attribute and ‘Activity Name’ as the Second Category Attribute.
- Aggregate Function: Select how you would like to aggregate the data.
- For example, to learn how many cases are processed by different resources you should select ‘Case Count’; to learn how many activities are performed by different resources you should select ‘Event Count’.
- Value Attribute: For certain values of ‘Aggregate Function’ (e.g., for ‘Sum’ or ‘Average’) you need to select a data attribute you are interested in.
- For example, if you wish to check average case duration by customer, you should select ‘Customer’ as the First Category Attribute, ‘Average’ as Aggregate Function and ‘Case Duration’ as Value Attribute.
- Max Categories: Specify the maximum number of categories that will be shown in the output.
- For example, you can set the value to 10 if you are only interested in top 10 customers.
- Category Ordering: Specify whether the values will be ordered in a descending or an ascending order.
- For example, if you wish to see resources with the maximum number of activity executions on top, you should select ‘Descending’.
Examples #
Example 1 #
To see top 10 Customers by total invoice value, use the following settings:

Output options:
1. Grid (default output)
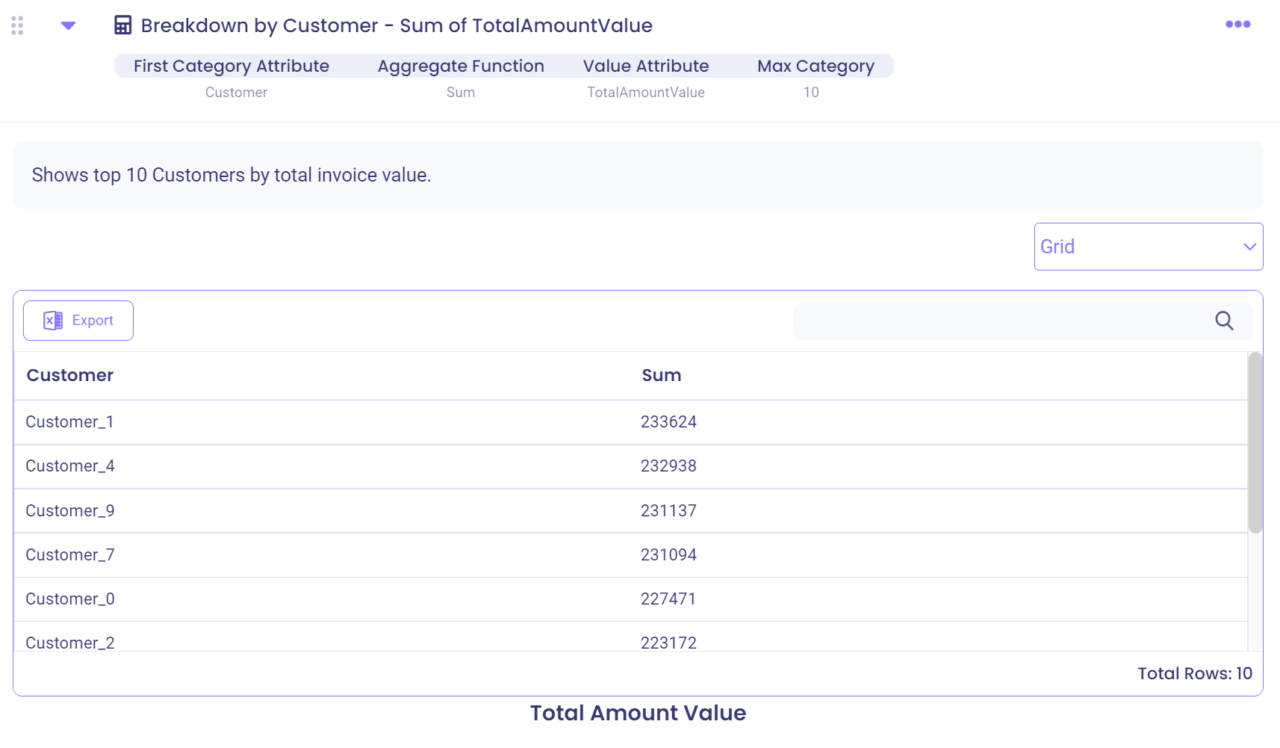
Click on a Customer name to see data for the selected Customer.
2. Horizontal bar chart (select from the dropdown list in the top right corner)
3. Pie chart (select from the dropdown list in the top right corner)
Example 2 #
To see the number of executions of different activities by top 10 resources, use the following settings:

Output options:
1. Tree map (default output)
To see activities performed by a specific resource, click on the resource, e.g., output for Resource_9:
2. Vertical grid (select from the dropdown list in the top right corner)
3. Grid (select from the dropdown list in the top right corner)
