mindzie logo - 150x50px
  • Products
    Intelligence Suite
    BPMN Modeling Software
    Process Mining
    Process Mining (On-Premises)
    Task Mining
    Data Designer (Log Creation)
    Modules
    AI Process Intelligence Copilot
    Automated Action Engine
    Operational Intelligence
    Python and Process Mining
    Process Mining – Services
  • Use Cases
    Department
    Compliance and Audit
    Finance
    IT Service Management
    Order to Cash
    Procure to Pay
    Industry
    Banking
    Health Care
    Insurance
    Manufacturing
    Process Improvement
    Utilities
  • Consultants
  • Resources
    Helpful Links
    Blog
    Online Training Portal
    Just Learning?
    What is Process Mining?
    Academic Process Mining License
    E-Book: Unlocking Enterprise Value with Process Mining & Intelligence
    EBook: Process Mining for Business Analysts
    EBook: Audit Log Recipe
  • Company
    About Us
    Careers
    Contact Us
Book Demo
Free Download
mindzie logo - 150x50px
Book Demo
  • Products
    Intelligence Suite
    BPMN Modeling Software
    Process Mining
    Process Mining (On-Premises)
    Task Mining
    Data Designer (Log Creation)
    Modules
    AI Process Intelligence Copilot
    Automated Action Engine
    Operational Intelligence
    Python and Process Mining
    Process Mining – Services
  • Use Cases
    Department
    Compliance and Audit
    Finance
    IT Service Management
    Order to Cash
    Procure to Pay
    Industry
    Banking
    Health Care
    Insurance
    Manufacturing
    Process Improvement
    Utilities
  • Consultants
  • Resources
    Helpful Links
    Blog
    Online Training Portal
    Just Learning?
    What is Process Mining?
    Academic Process Mining License
    E-Book: Unlocking Enterprise Value with Process Mining & Intelligence
    EBook: Process Mining for Business Analysts
    EBook: Audit Log Recipe
  • Company
    About Us
    Careers
    Contact Us

Getting Started

7
  • Load Dataset
  • Create Investigation
  • Create Analysis
  • Add Filter
  • Add Calculator
  • Add Log Enrichment
  • Create Dashboard

Frequency Filters

4
  • Value Frequency
  • Activity Performed Once
  • Activity Not Performed
  • Selected Activity Frequency

Overview

8
  • Case Explorer
  • Process Map
  • Resource Performance vs Conformance
  • Dataset Information
  • Process Performance Matrix
  • Data Selector
  • Export Image (Process Map and Dashboard)
  • Full screen Process Map

Time Filters

1
  • Time Period

Duration Filters

1
  • Deadline

Order Filters

3
  • Process Variants
  • Event Order
  • Case End

AI Calculators

2
  • Automation
  • Root Cause Analysis

Attribute Calculators

9
  • Average Value
  • Breakdown by Categories
  • Sum of Values
  • Sum of Values for Activity
  • Trend
  • Minimum Value
  • Maximum Value
  • Selected Cases by Category
  • Duplicate Cases

Frequency Calculators

7
  • Rate
  • Value Count in Case Attribute
  • Value Count in Event Attribute
  • Histogram
  • Repeated Activities
  • Activity Information
  • Case Count

Time Calculators

4
  • Selected Cases by Category Over Time
  • Selected Cases Over Time
  • Rate Over Time
  • Time Between All Activity Pairs

Duration Calculators

3
  • Case Duration
  • Time From Case Start to Selected Event
  • Time Between Selected Events

Advanced Calculators

1
  • What-If Simulation: Working Capital

Conformance Enrichments

4
  • Allowed Case Start Activities
  • Wrong Activity Order
  • Repeated Activity
  • Allowed Case End Activities

Attribute Enrichments

10
  • Events with Attribute
  • Cases with Attribute
  • Duration Between Two Activities
  • Duration Between an Attribute and an Activity
  • Representative Case Attribute
  • Multiply
  • Subtract
  • Divide
  • Case Closed
  • Cases with Changed Attribute

Sample Datasets

1
  • Sample Datasets

Datasets

1
  • Update Dataset from CSV
  • Home
  • Docs
  • mindzie studio Help
  • Getting Started
  • Create Dashboard
View Categories

Create Dashboard

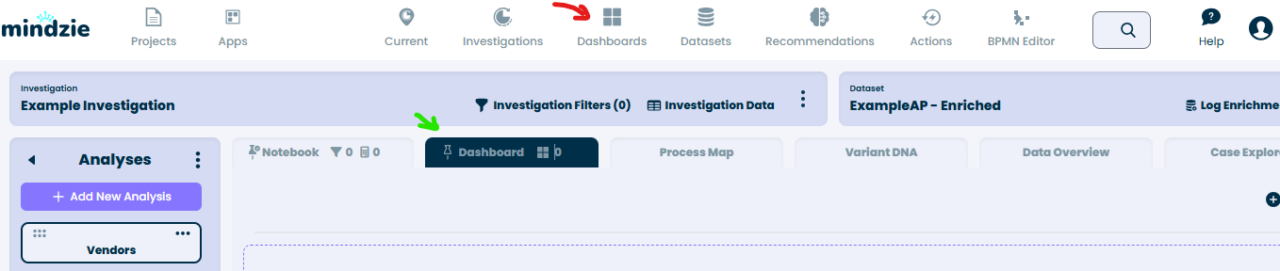
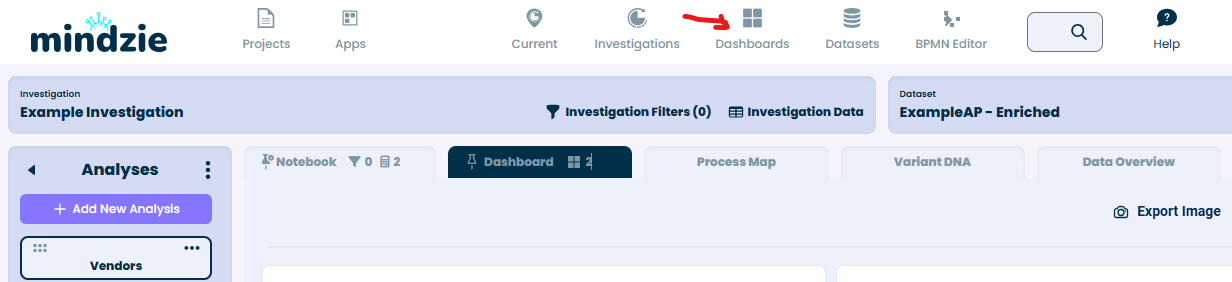
Dashboards are used to highlight and visualize analysis results. Once you open an investigation, you can see ‘Dashboards’ in the main menu on top (highlighted with red on the screenshot below) and a ‘Dashboard’ tab for an analysis (highlighted with green). ‘Dashboards’ in the main menu show global Dashboards which can include panels from multiple analyses and investigations (the list is empty if no global dashboards were created). ‘Dashboard’ tab shows the dashboard that was created for a selected analysis.

In the example below we will create an analysis dashboard and a global dashboard.

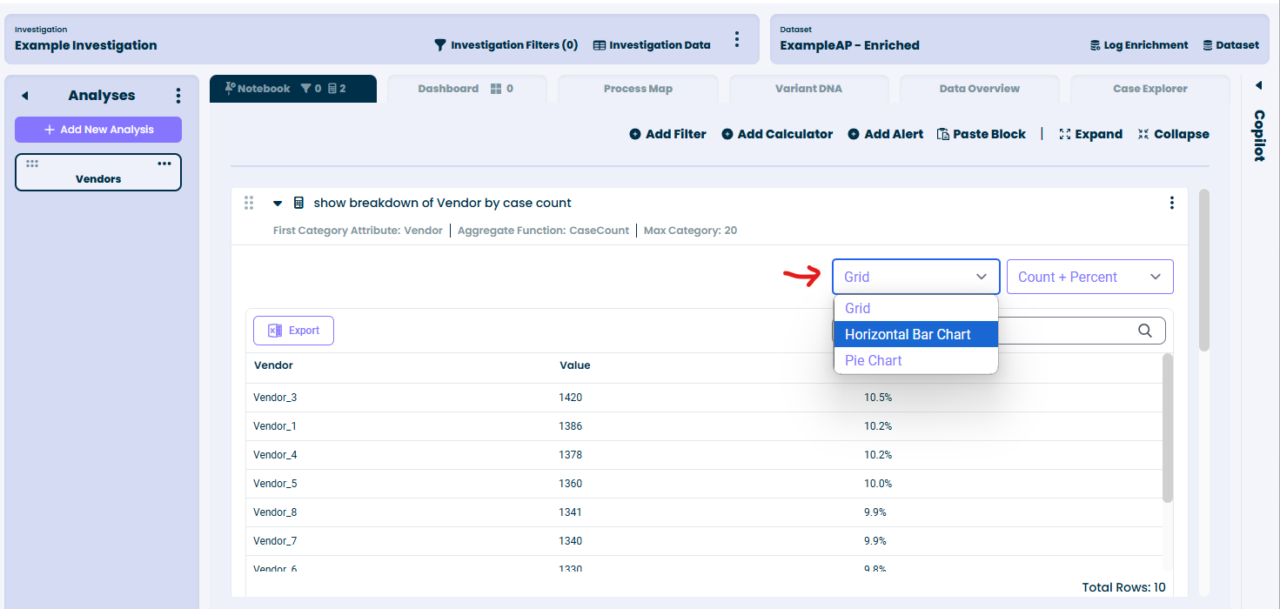
Dashboards are created from calculator outputs. In the example, we will use ‘Breakdown by Category’ calculator twice with different settings: 1) to show the number of cases per Vendor; 2) to show average case duration per Vendor (see Add Calculator for information about calculators).

After calculators are added, they show grid output by default. To change the output to ‘Horizontal Bar Chart’, click ‘Grid’ and select the corresponding option from the list:

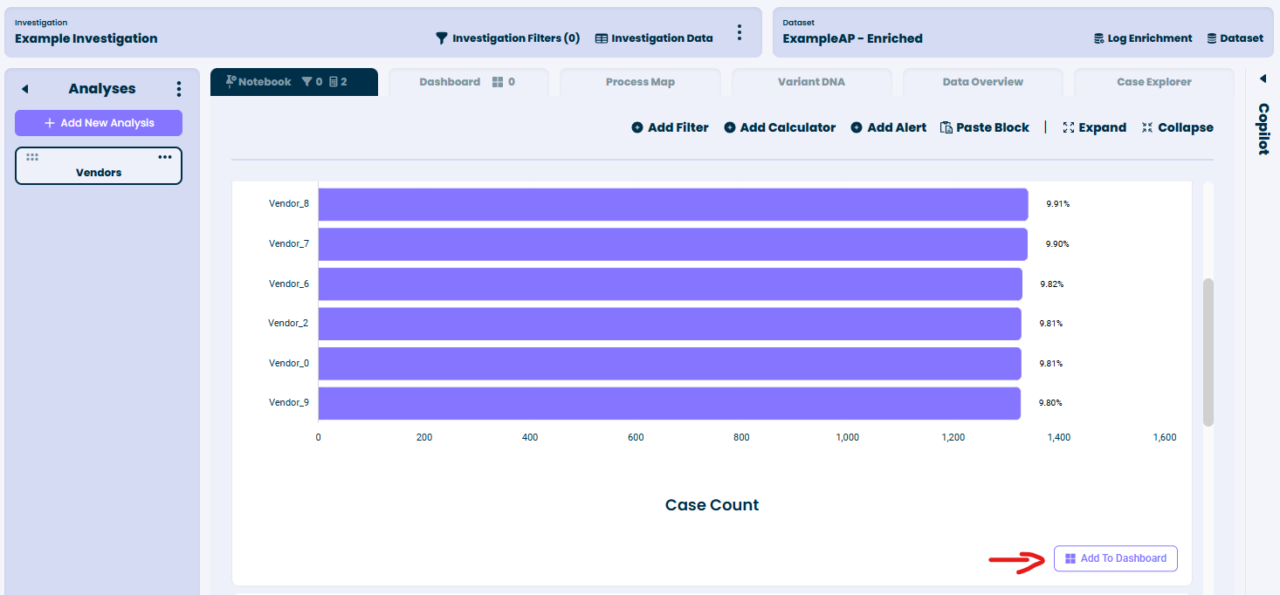
Press ‘Add to Dashboard’ button for each calculator to add the charts to Dashboard:

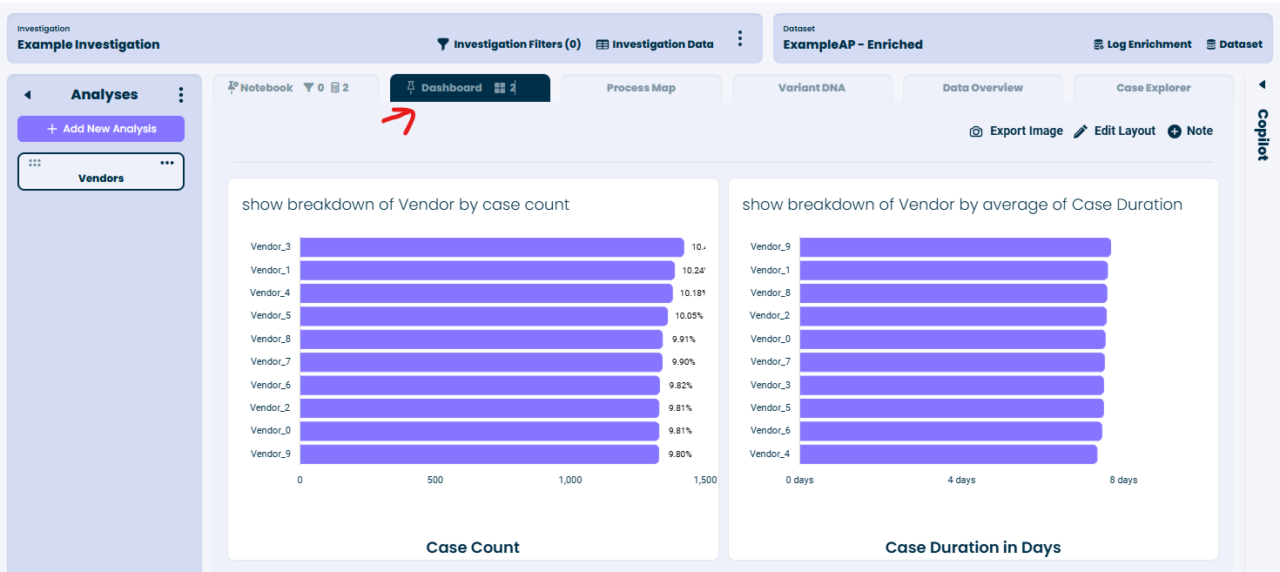
Click Dashboard Tab to see the analysis Dashboard:

To create a global dashboard, click ‘Dashboards’ in the main menu:

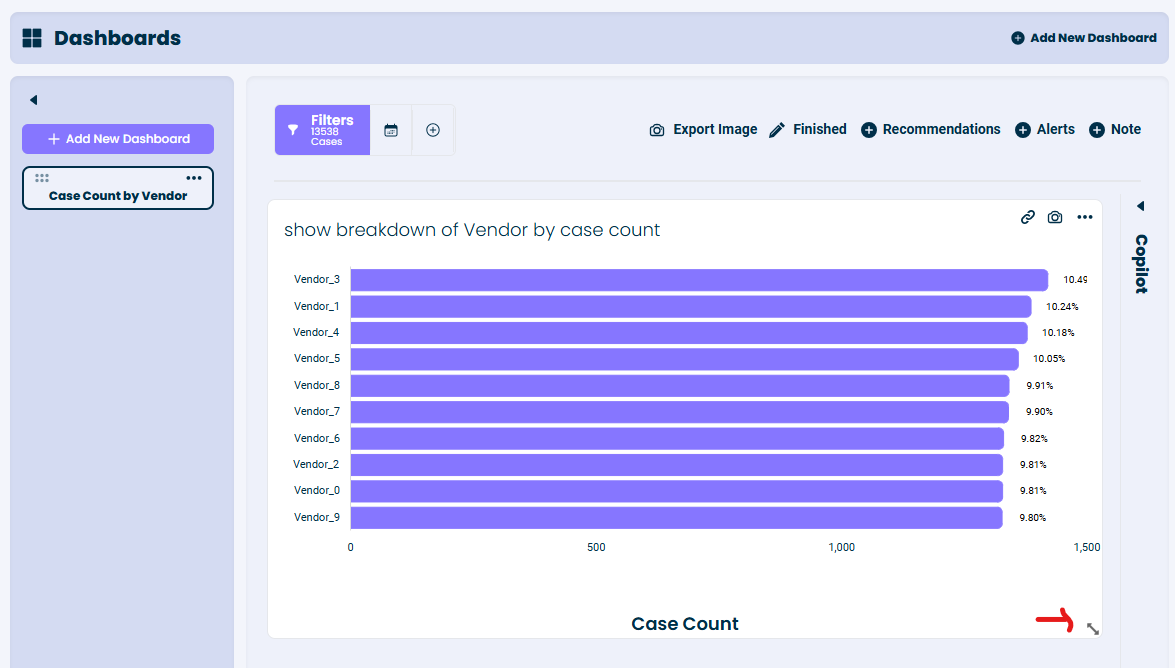
Click ‘Add New Dashboard’ button and specify dashboard name in the pop-up window (we will create ‘Case Count by Vendor’ dashboard in the example):

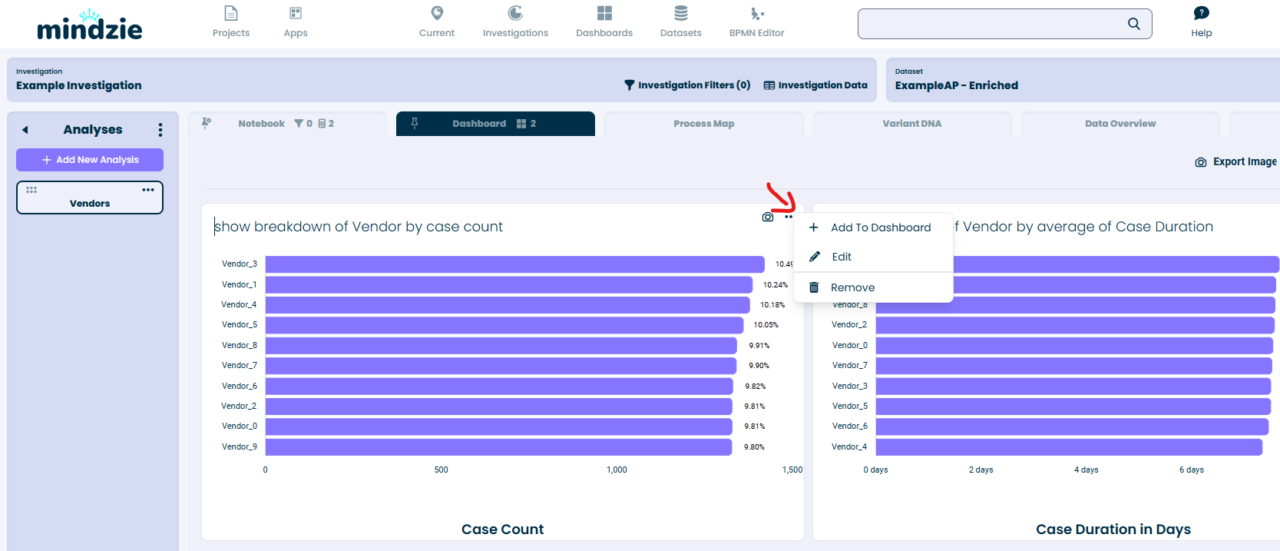
An empty dashboard ‘Case Count by Vendor’ will be created. To add a data panel to the global dashboard, open an analysis dashboard with the data panel you wish to add, click three dots (in the top right corner) for a selected data panel and click ‘Add To Dashboard’:

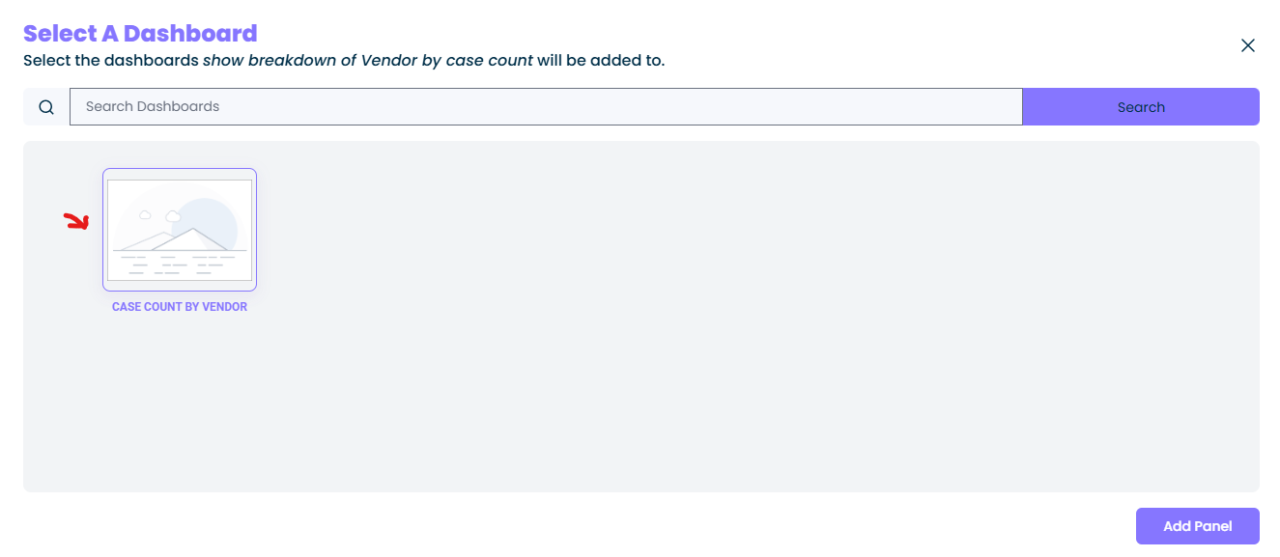
Select a dashboard to which you want to add the data panel and press ‘Add Panel’ button:

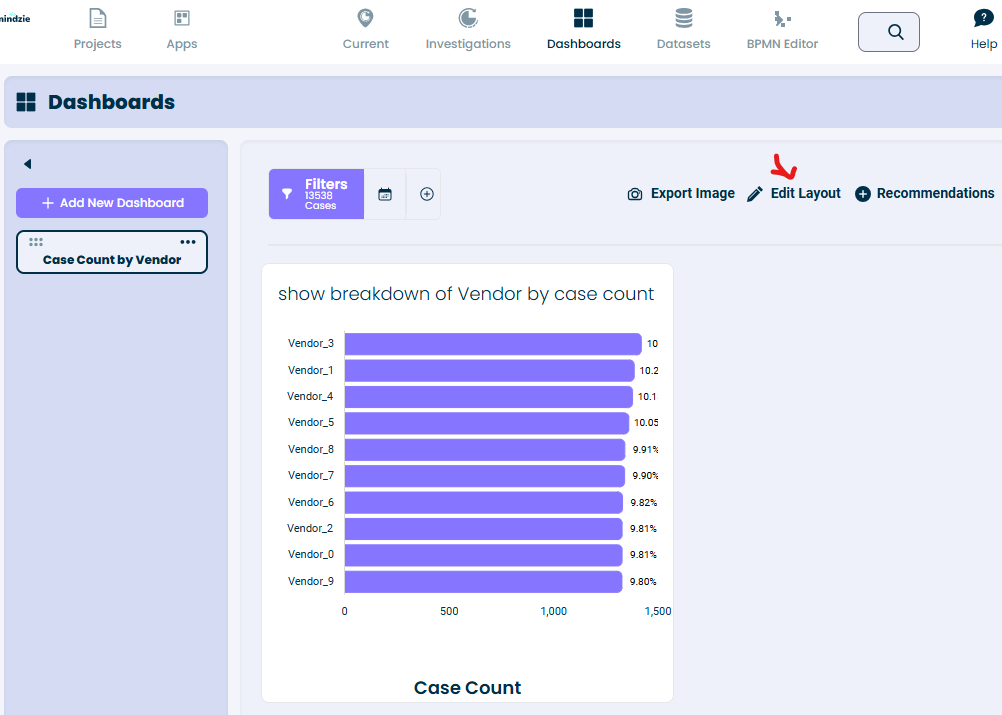
To see the dashboard with the added panel, click ‘Dashboards’ in the main menu and select a corresponding dashboard (there is only one dashboard in the example).

If you want to resize or move the panel on the dashboard, click ‘Edit Layout’ button:

In our example, we increased the size of the panel (by dragging the bottom right corner of the data panel):

In this example, we only added one panel to the global dashboard; you can add multiple panels from different investigations and analyses.

For further information about dashboards, see our help documentation.

Still stuck? How can we help?

Still stuck? How can we help?

Add Log Enrichment
Image link

Our AI-Driven Process Intelligence Platform with Automated Actions and out of the box connectors is helping transform organizations across the globe.

Contact Us

Quick Links

HomeBook a DemoConsultantsBlogFree Download

Products

BPMN ModelingProcess MiningTask MiningData Designer

Resources

TrainingHelp Center

Company

About UsCareersPrivacy Policy

Image link

© 2025 mindzie. All rights reserved. This website uses remarketing to advertise on third party websites. You can opt out at any time by changing cookie settings.