mindzie logo - 150x50px
  • Products
    Intelligence Suite
    BPMN Modeling Software
    Process Mining
    Process Mining (On-Premises)
    Task Mining
    Data Designer (Log Creation)
    Modules
    AI Process Intelligence Copilot
    Automated Action Engine
    Operational Intelligence
    Python and Process Mining
    Process Mining – Services
  • Use Cases
    Department
    Compliance and Audit
    Finance
    IT Service Management
    Order to Cash
    Procure to Pay
    Industry
    Banking
    Health Care
    Insurance
    Manufacturing
    Process Improvement
    Utilities
  • Consultants
  • Resources
    Helpful Links
    Blog
    Online Training Portal
    Just Learning?
    What is Process Mining?
    Academic Process Mining License
    E-Book: Unlocking Enterprise Value with Process Mining & Intelligence
    EBook: Process Mining for Business Analysts
    EBook: Audit Log Recipe
  • Company
    About Us
    Careers
    Contact Us
Book Demo
Free Download
mindzie logo - 150x50px
Book Demo
  • Products
    Intelligence Suite
    BPMN Modeling Software
    Process Mining
    Process Mining (On-Premises)
    Task Mining
    Data Designer (Log Creation)
    Modules
    AI Process Intelligence Copilot
    Automated Action Engine
    Operational Intelligence
    Python and Process Mining
    Process Mining – Services
  • Use Cases
    Department
    Compliance and Audit
    Finance
    IT Service Management
    Order to Cash
    Procure to Pay
    Industry
    Banking
    Health Care
    Insurance
    Manufacturing
    Process Improvement
    Utilities
  • Consultants
  • Resources
    Helpful Links
    Blog
    Online Training Portal
    Just Learning?
    What is Process Mining?
    Academic Process Mining License
    E-Book: Unlocking Enterprise Value with Process Mining & Intelligence
    EBook: Process Mining for Business Analysts
    EBook: Audit Log Recipe
  • Company
    About Us
    Careers
    Contact Us

Getting Started

7
  • Load Dataset
  • Create Investigation
  • Create Analysis
  • Add Filter
  • Add Calculator
  • Add Log Enrichment
  • Create Dashboard

Frequency Filters

4
  • Value Frequency
  • Activity Performed Once
  • Activity Not Performed
  • Selected Activity Frequency

Overview

8
  • Case Explorer
  • Process Map
  • Resource Performance vs Conformance
  • Dataset Information
  • Process Performance Matrix
  • Data Selector
  • Export Image (Process Map and Dashboard)
  • Full screen Process Map

Time Filters

1
  • Time Period

Duration Filters

1
  • Deadline

Order Filters

3
  • Process Variants
  • Event Order
  • Case End

AI Calculators

2
  • Automation
  • Root Cause Analysis

Attribute Calculators

9
  • Average Value
  • Breakdown by Categories
  • Sum of Values
  • Sum of Values for Activity
  • Trend
  • Minimum Value
  • Maximum Value
  • Selected Cases by Category
  • Duplicate Cases

Frequency Calculators

7
  • Rate
  • Value Count in Case Attribute
  • Value Count in Event Attribute
  • Histogram
  • Repeated Activities
  • Activity Information
  • Case Count

Time Calculators

4
  • Selected Cases by Category Over Time
  • Selected Cases Over Time
  • Rate Over Time
  • Time Between All Activity Pairs

Duration Calculators

3
  • Case Duration
  • Time From Case Start to Selected Event
  • Time Between Selected Events

Advanced Calculators

1
  • What-If Simulation: Working Capital

Conformance Enrichments

4
  • Allowed Case Start Activities
  • Wrong Activity Order
  • Repeated Activity
  • Allowed Case End Activities

Attribute Enrichments

10
  • Events with Attribute
  • Cases with Attribute
  • Duration Between Two Activities
  • Duration Between an Attribute and an Activity
  • Representative Case Attribute
  • Multiply
  • Subtract
  • Divide
  • Case Closed
  • Cases with Changed Attribute

Sample Datasets

1
  • Sample Datasets

Datasets

1
  • Update Dataset from CSV
  • Home
  • Docs
  • mindzie studio Help
  • Calculators
  • Frequency Calculators
  • Histogram
View Categories

Histogram

Overview #

The calculator shows the distribution of values of a selected attribute. Typically, the histogram takes a KPI as an input and shows the case distribution on it. It is useful for seeing the central values, the shape and the size of the distribution.

Common Uses #

  • See the distribution of invoice payments: are they mainly early, on-time or late?
  • See the distribution of case durations.
  • See the distribution of processing times.
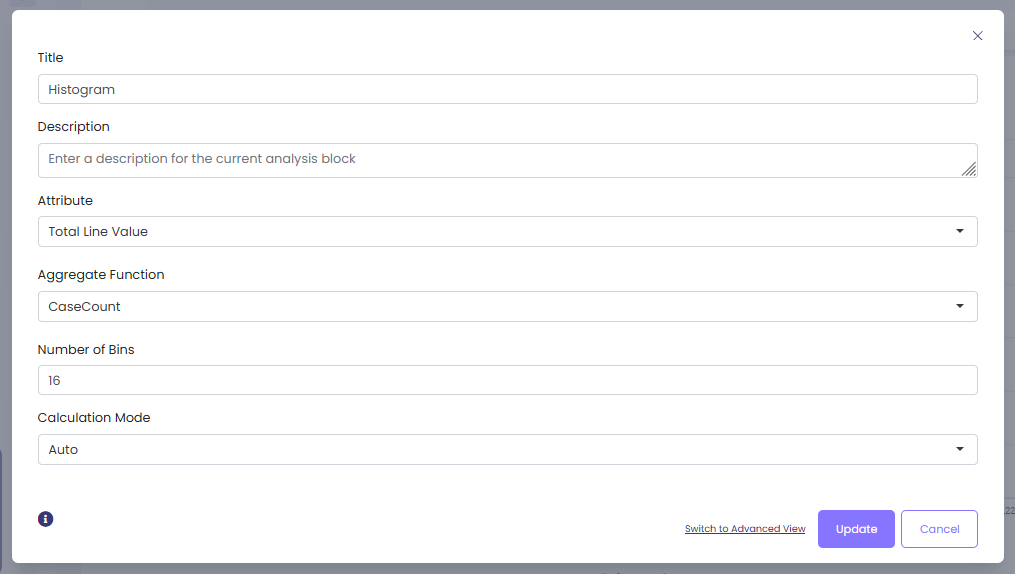
Settings #

  • Attribute: Select the attribute you wish to analyze.
  • Aggregate Function: Select how to aggregate the data: by case count, by sum or by max, median or min values.
Aggregate FunctionDescription
Case CountReturns the number of cases in each bin
MaxReturns the maximum value for each bin
MedianReturns the median value for each bin
MinReturns the minimum value for each bin
SumReturns the sum of values for each bin
  • Number of Bins: Specify the number of bins to distribute the data into. Bins are also known as ranges, groups, or intervals.
  • Calculation Mode: It is easier to start with Auto Mode and then fine tune your histogram using the full-range or manual mode.
NameDescriptionExample
Auto ModeSelects the appropriate values and units automatically.For example, for case duration distribution, it will show the distribution of cases in days, starting from 0 days to 190 days (it might show values in hours, weeks, etc depending on your data).
Full Range ModeSelects the full range of values, including outliers.If case durations are anywhere between 0 days and 1200 days (obviously an outlier or an incorrectly entered value), the calculator will show the full range of values in the histogram.
Manual ModeSelect the appropriate values and measurement units manually.Min Value: specify the lowest value to use in the calculation.
Max Value: specify the highest value to use in the calculation.
Duration Units: specify the duration units (minutes, hours, days, weeks, etc)

Examples #

Example 1 #

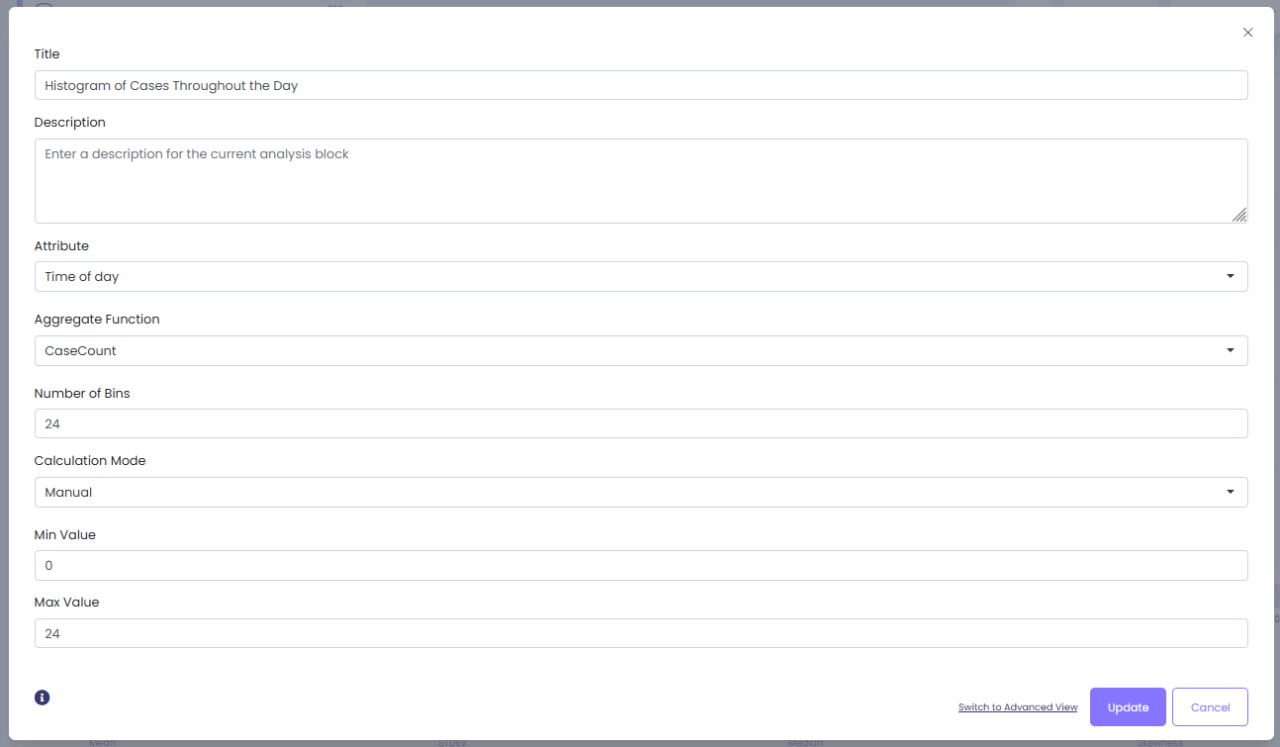
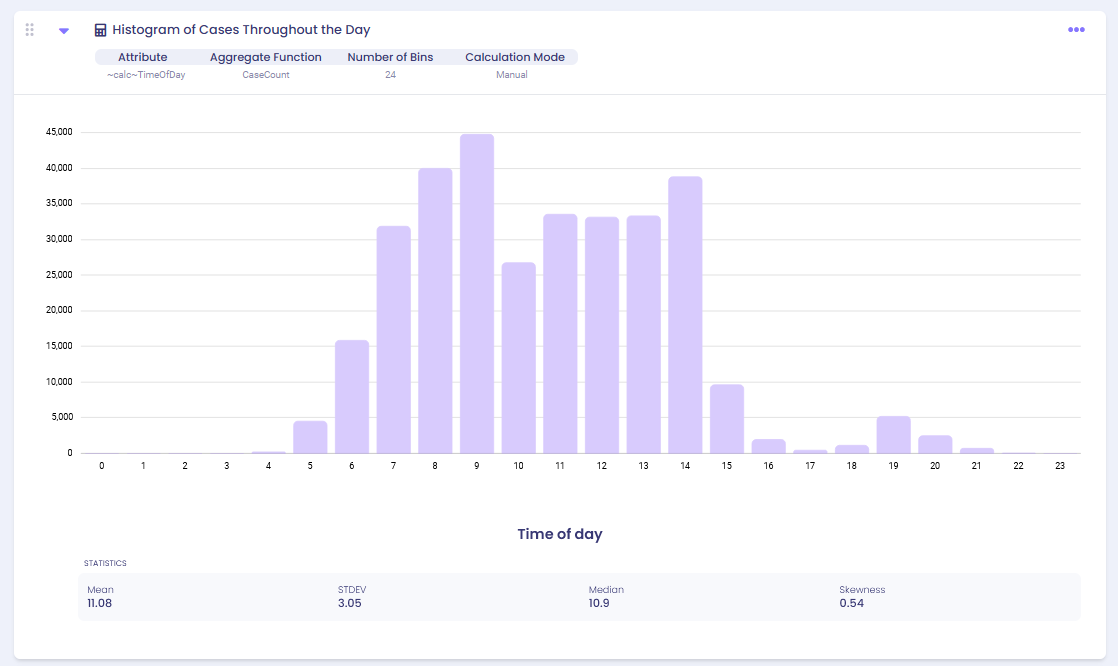
To analyze the distribution of cases throughout the day we selected “Time of Day” as our attribute and specified 24 bins to represent each hour of the day. The min and max values represent the start and end of the day.

Output:

The histogram shows that most cases started between 6am and 3pm, with some cases falling outside of the typical working hours.

Example 2 #

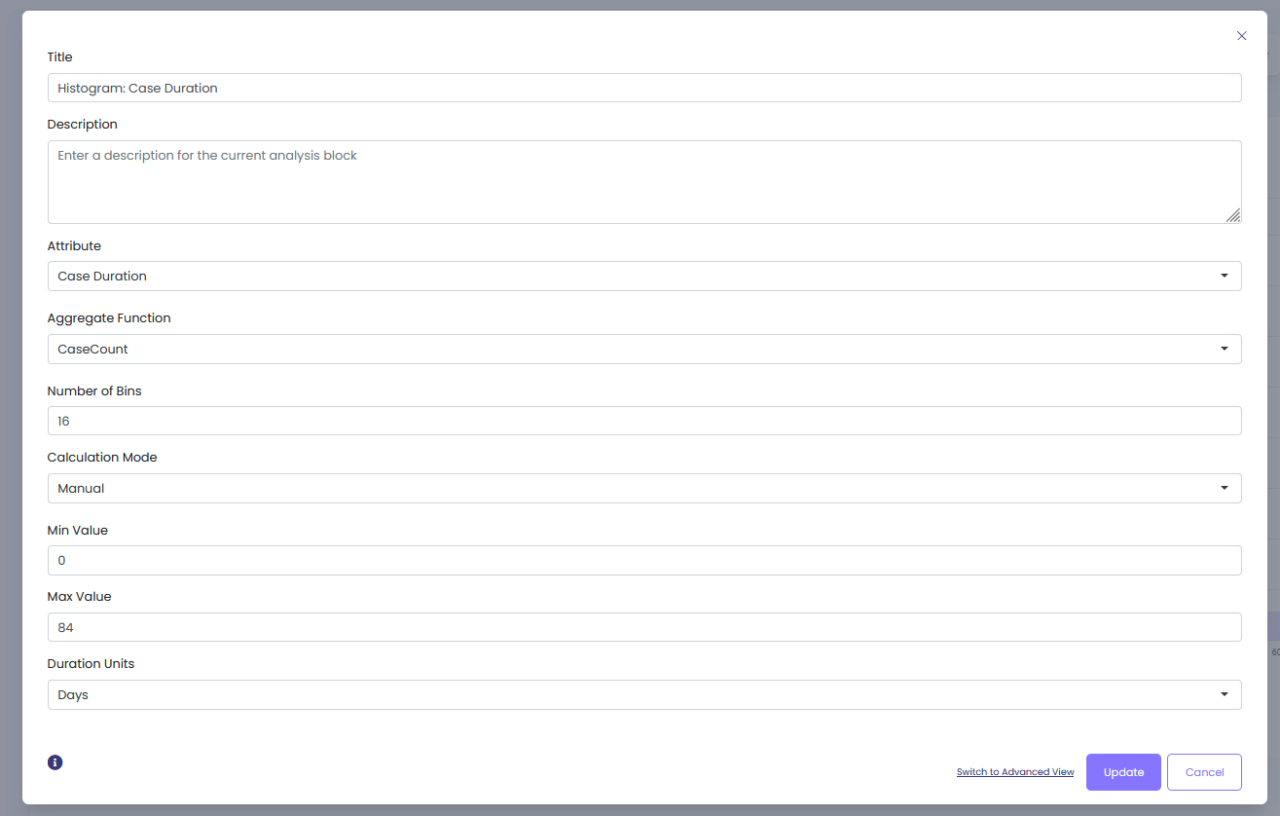
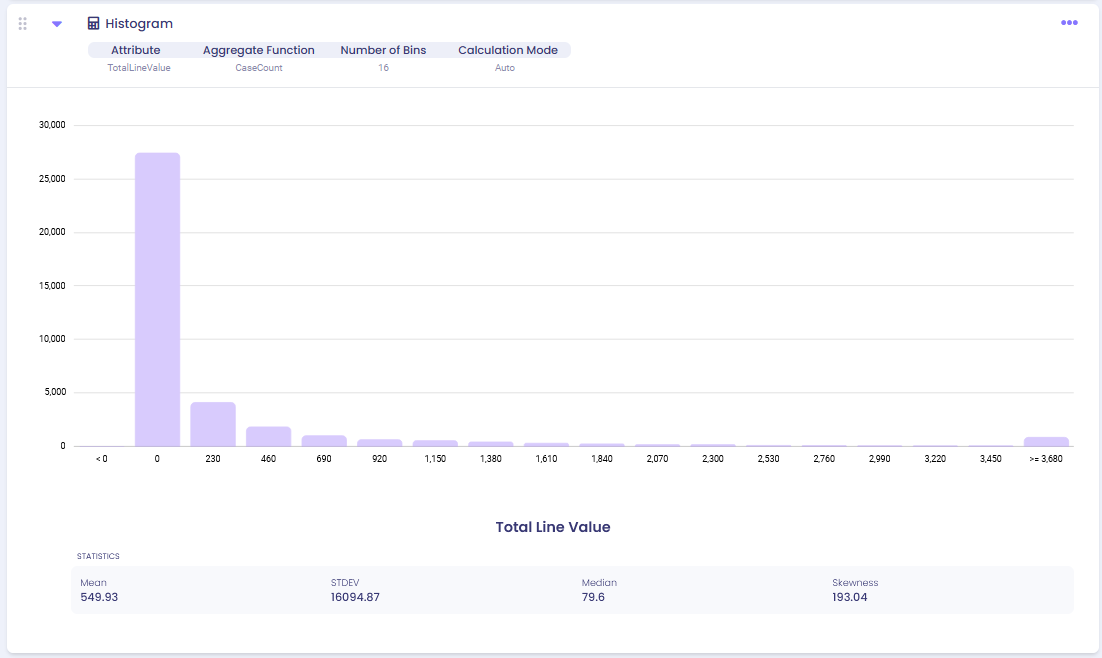
To analyze the distribution of total cost of purchase orders, use the following settings:

Output:

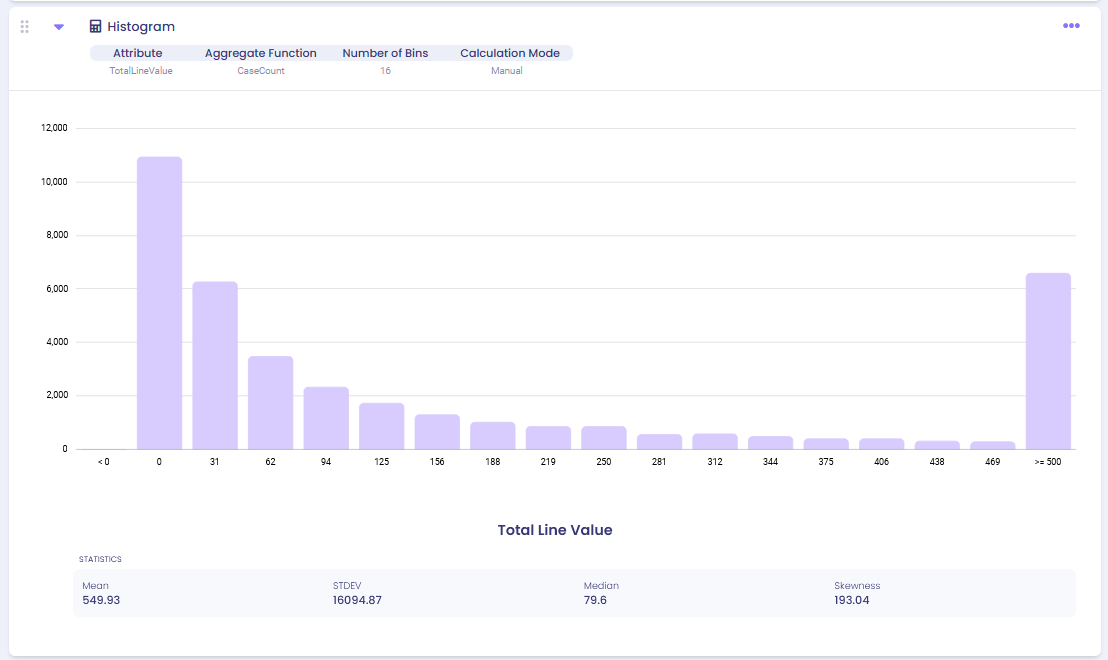
The histogram shows that most of the purchase orders were on the lower end, below $1,000.

Example 3 #

To analyze the purchase orders more closely, in settings: select the manual calculation mode and specify the max value to be 500, for example.
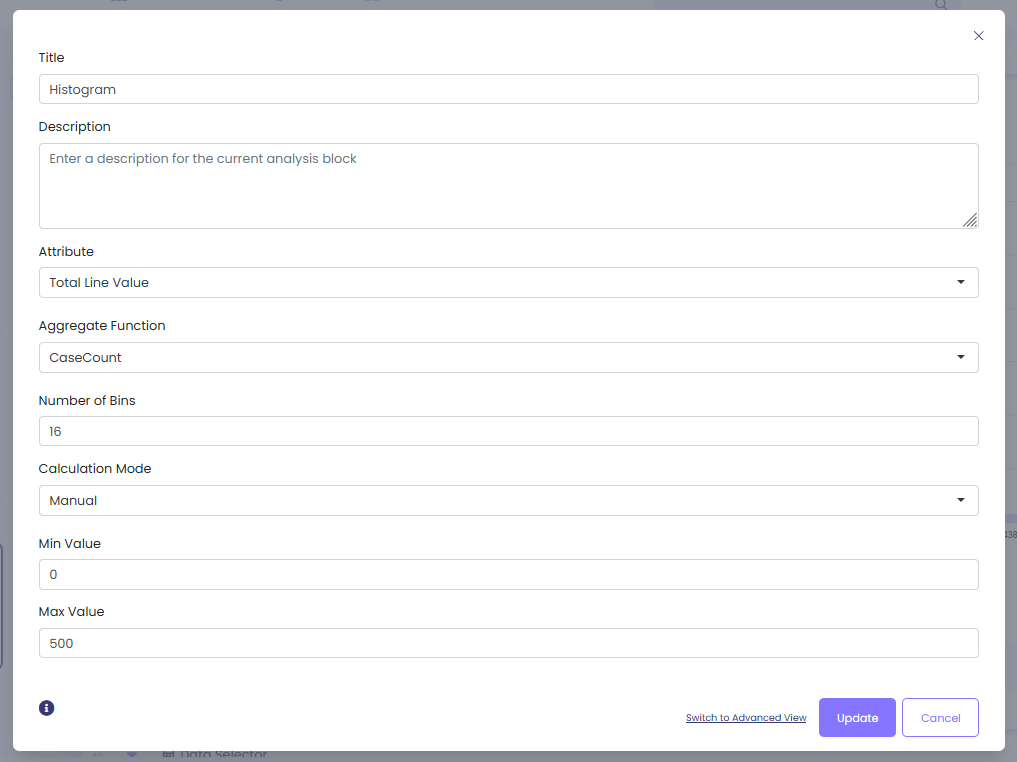
Output:

Still stuck? How can we help?

Still stuck? How can we help?

Value Count in Event AttributeRepeated Activities
Table of Contents
  • Overview
  • Common Uses
  • Settings
  • Examples
    • Example 1
    • Example 2
    • Example 3
Image link

Our AI-Driven Process Intelligence Platform with Automated Actions and out of the box connectors is helping transform organizations across the globe.

Contact Us

Quick Links

HomeBook a DemoConsultantsBlogFree Download

Products

BPMN ModelingProcess MiningTask MiningData Designer

Resources

TrainingHelp Center

Company

About UsCareersPrivacy Policy

Image link

© 2025 mindzie. All rights reserved. This website uses remarketing to advertise on third party websites. You can opt out at any time by changing cookie settings.