Overview #
The calculator is used to compare the trends or changes in a selected attribute over time, or for different groups (e.g., departments).
Common Uses #
- Compare two years by sales, invoice amounts, number of cases, etc.
- Compare sales in Q1 and Q2 in different regions.
Settings #
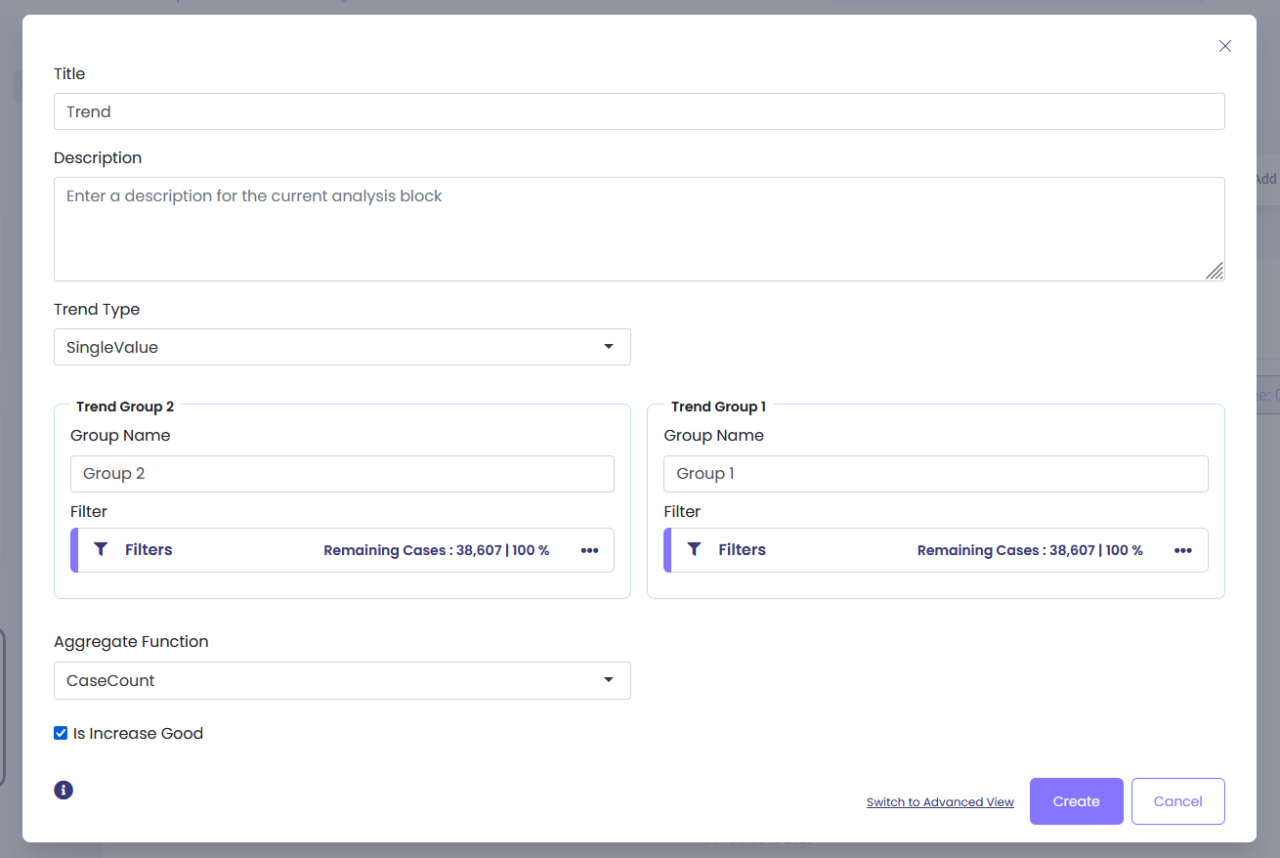
Trend type:
| Value | Description | Example |
| SingleValue | Select to calculate an overall trend value. The output will show whether the value of your attribute (e.g., duration or cost) had a positive or a negative change over time. | See whether the total cost of items increased or decreased from Y1 to Y2. |
| MultipleValue | Select to calculate trend values for different categories (e.g., for different item types or Vendors). The output will show the trend for each category of the attribute. Breakdown Attribute: select the attribute which defines categories (e.g., Vendor). Â | See whether the cost changed from Y1 to Y2 for different item types. |
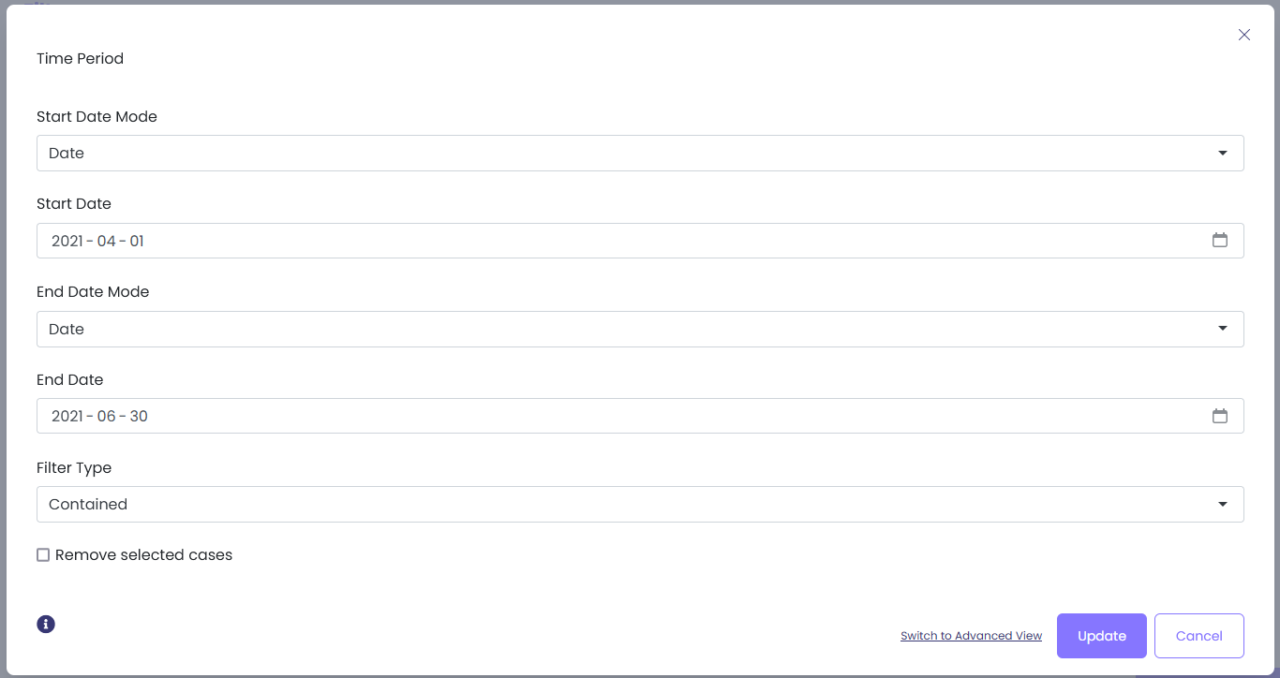
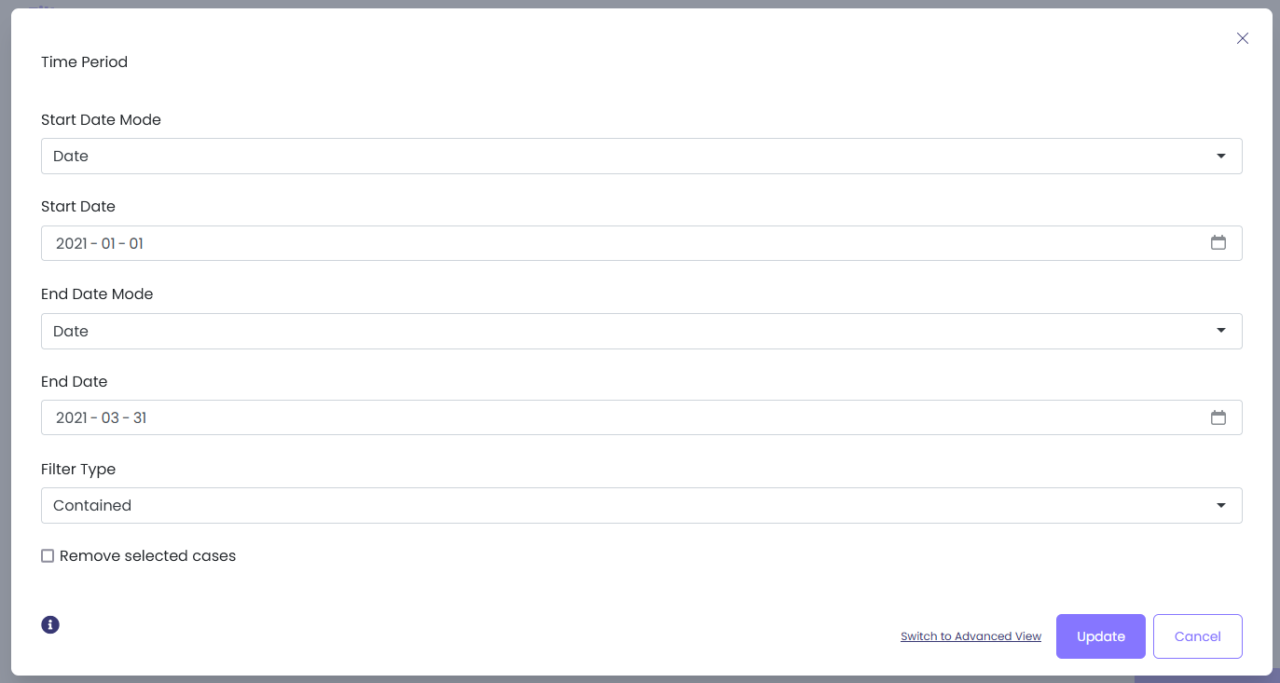
- Filter: Click on three dots -> Open Filters -> Add Filter:select the filter to apply to your first group (repeat the process for the second group). The first group represents the base group and the second group is the comparison group. For instance, you can apply a time filter to group 1 to select the year of 2020 and apply a time filter to group 2 to select the year of 2021.
- Aggregate Function: choose how you would like to compare your values: by sum, case count, averages, etc.
- Value Attribute: If your selection is not Case Count or Event Count, select the attribute which you would like to compare across groups.
- Is Increase Good: put a check mark, if increase in values is a positive change (ex.: increase in sales); don’t put a check mark, if increase in values is a negative change (ex: increase in costs).
Examples #
Example 1: Comparing the total item quantities in Q1 to Q2 2021 #
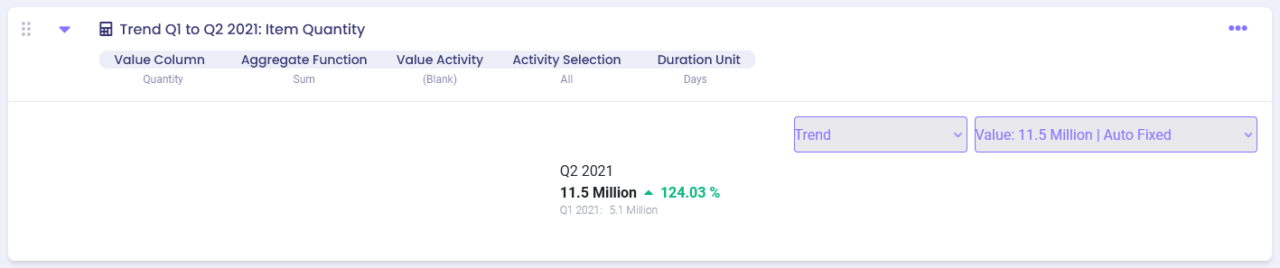
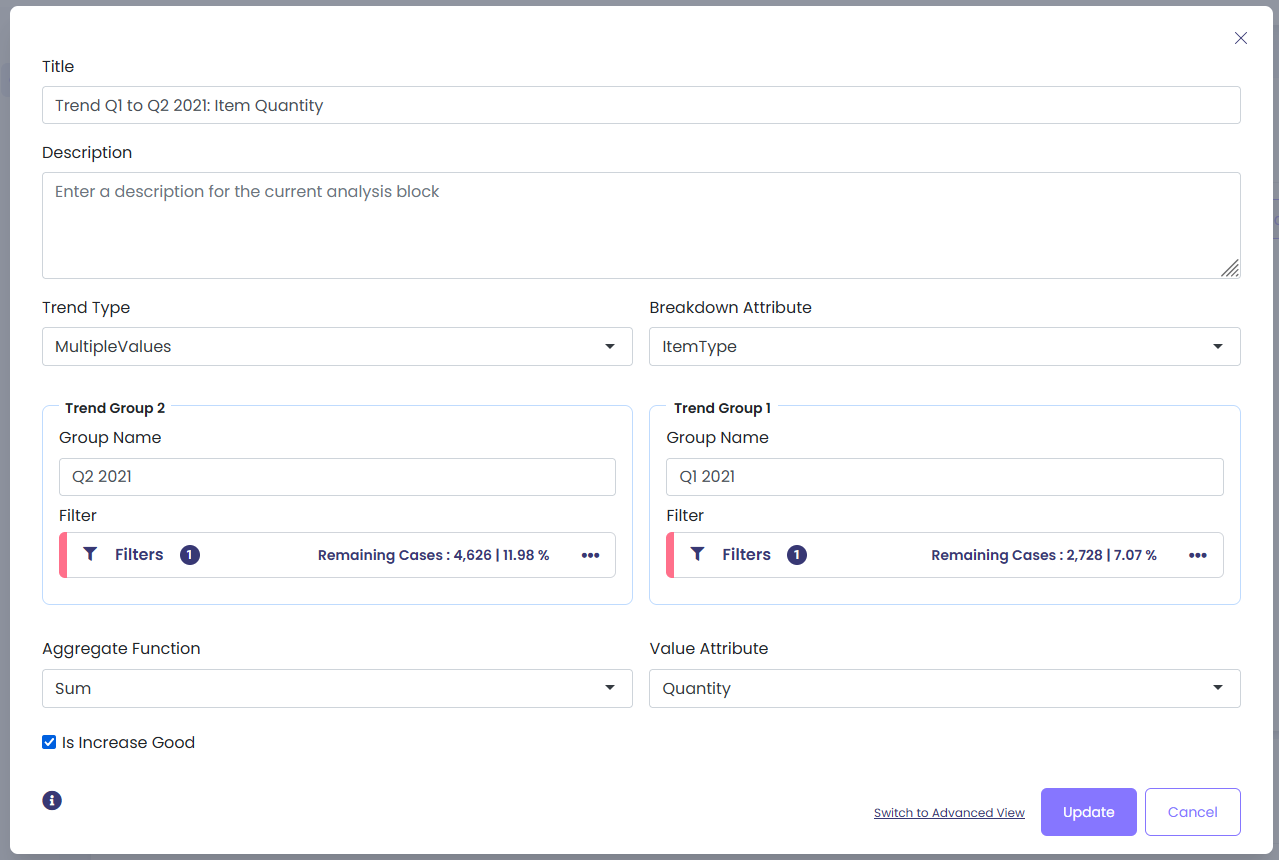
We have two trend groups: Q1 2021 and Q2 2021. Our goal is to identify see whether there was an increase or a decrease in the total umber of items ordered between the two quarters. In our case, increase in total quantity indicates a positive outcome, so we select increase is good.
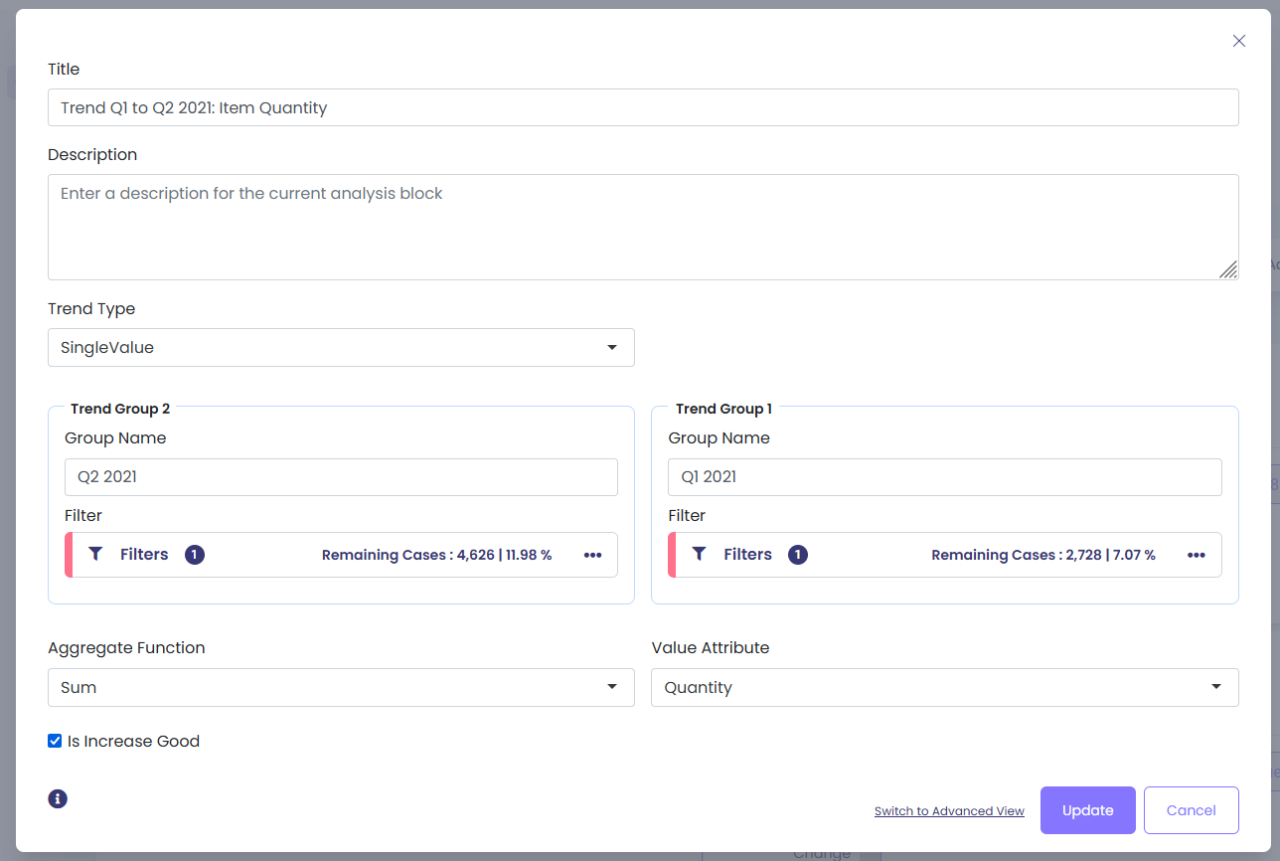
Trend Group 2. Filter Applied – Time Period: Q2 2021
Trend Group 1. Filter Applied – Time Period: Q1 2021
Here’s what we get:
Example 2: Comparing the total item costs in different vendor regions in 2020 to 2021 #
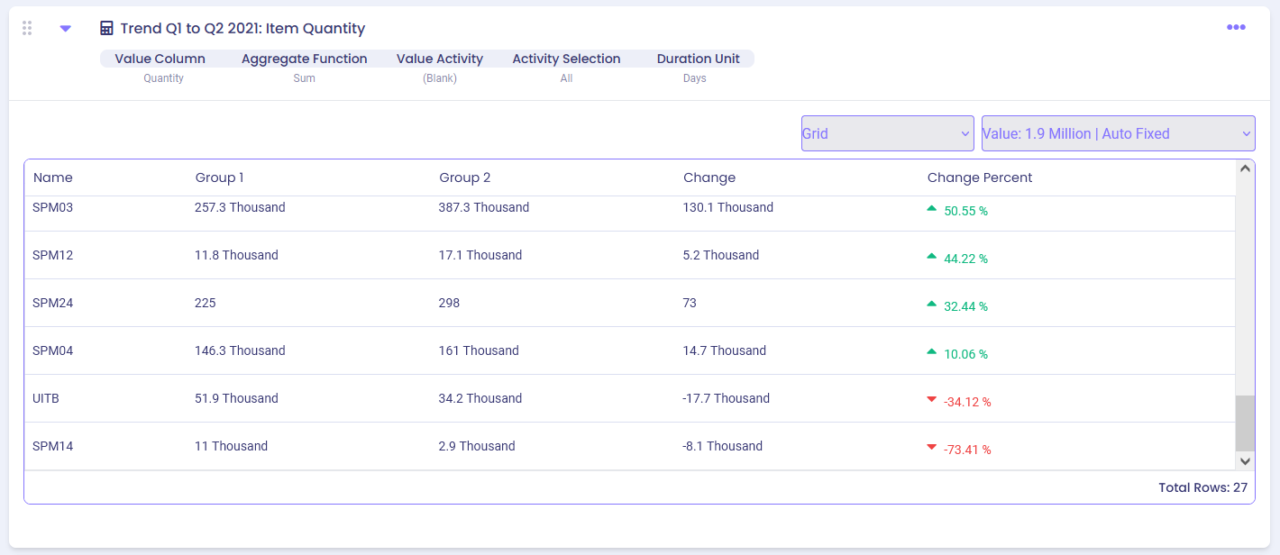
Here we are using multiple values as our trend type to compare the change in total quantities of different item types from Q1 in 2021 to Q2 in 2021.
Here’s what we get:
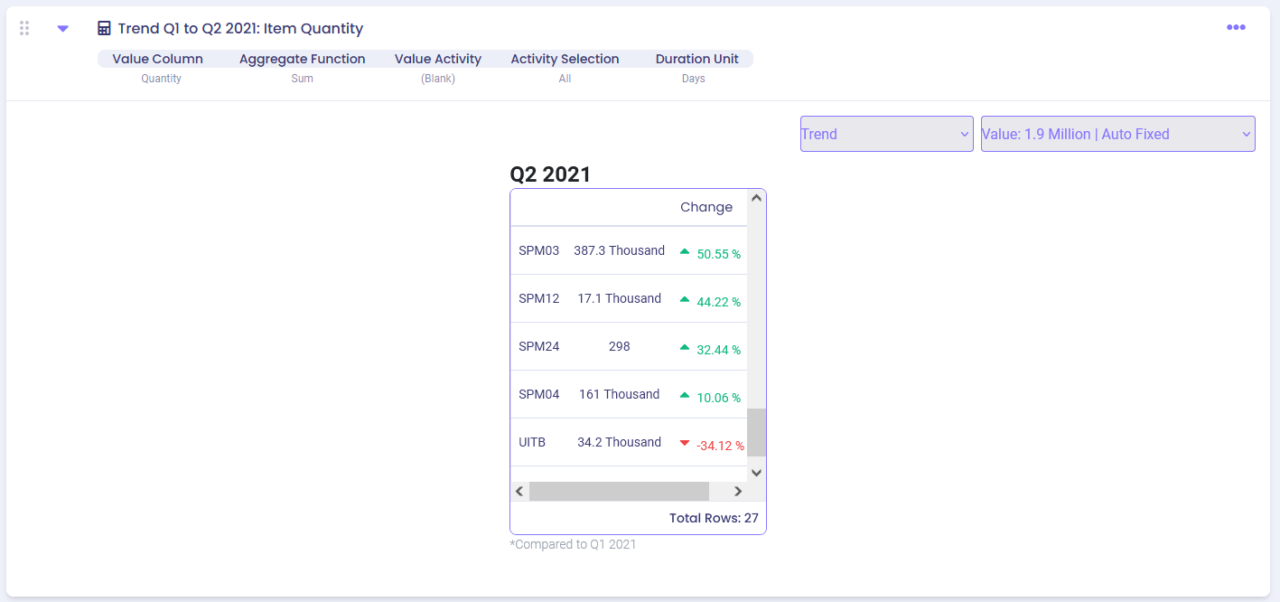
We see the item type in the 1st column, along with the difference in quantity ordered between Q1 and Q2: 2nd column shows the quantity difference and 3rd column shows the percentage difference.
To see the values in a tabular format, select Grid instead of Trend: