Overview #
The calculator shows the number and the percentage of cases with a selected property, broken down by category.
Common Uses #
- See how many invoices were cancelled depending on the day of the week
- See how many deliveries were late for each of the vendors
Settings #
- Attribute Name: Select the attribute that represents the category for which you want to analyze the selected cases.
- Select cases in which
- Select the attribute that you want to filter on from the drop down.
- Chose how you wish to filter. Filter options depend on the type of attribute data (ex.: “Vendor†is a text thus you can filter on the names of the vendors, while “case duration†is a number thus you can filter on number of minutes, hours, days, etc):
| Text | Filter cases that contain, start with or end with specific text values. Or select cases in which your attribute “is†or “is one of†the available values. |
| Numbers (amounts, durations, etc) | Filter cases based on logical operators. For instance, filter out cases that take 60 or more days, filter out invoices that are less than $120, etc. |
| Dates | Filter cases that happened on a specific date or happened within a certain date range. For advanced date filtering prior to using the calculator, use Time Period filter |
| Boolean | Filter cases that are either true or false. For instance, select cases in which InvoiceCancelled is True. |
- Remove Selected Cases: Select the check box to discard the filtered cases and not include them in further analysis.
Examples #
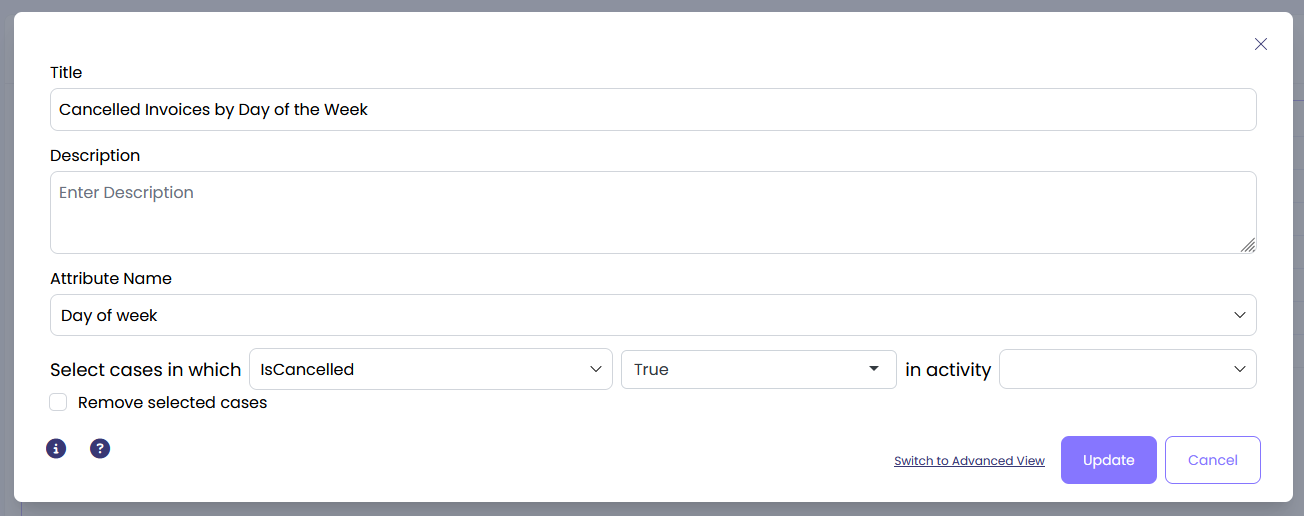
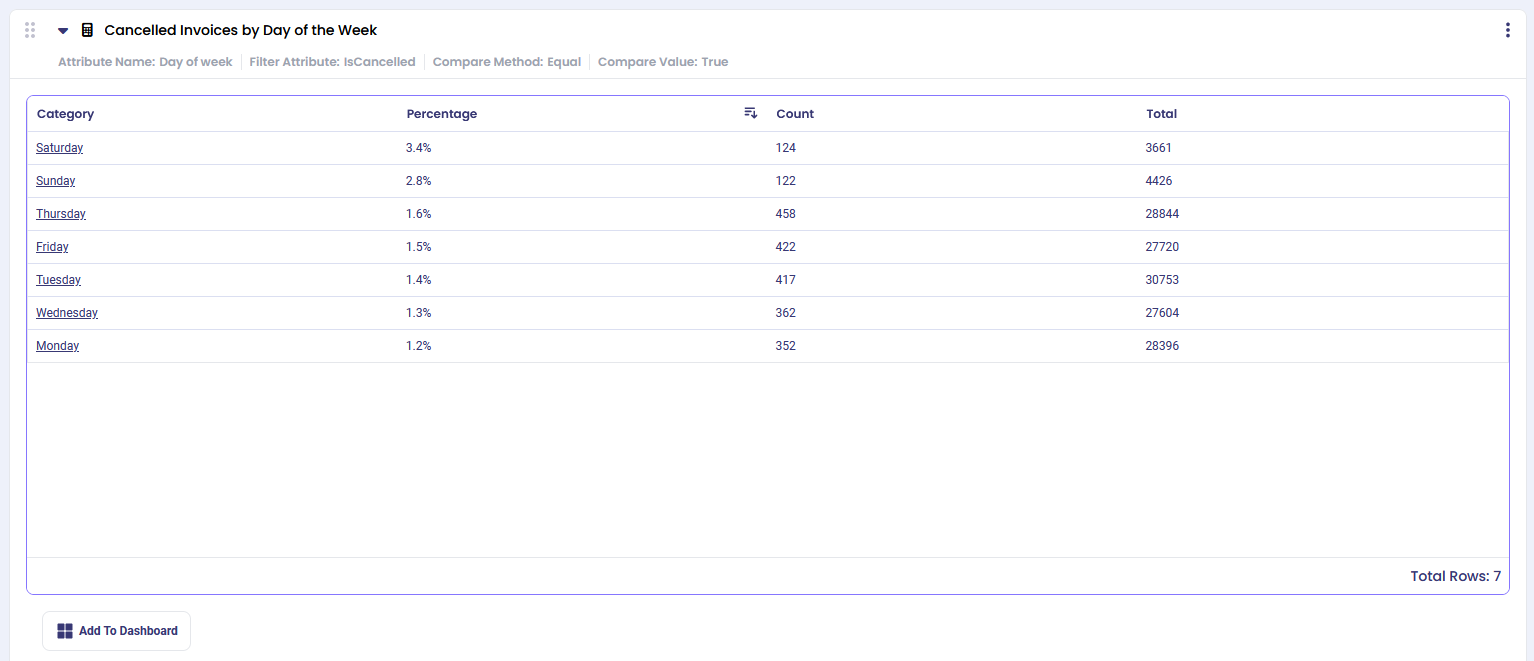
Example 1: Cancelled Invoices #
To see how many invoices are cancelled depending on the day of the week, use the following settings:
The output shows the percent of cancelled invoices for different days of the week. Click on any of the column titles to sort by that column.
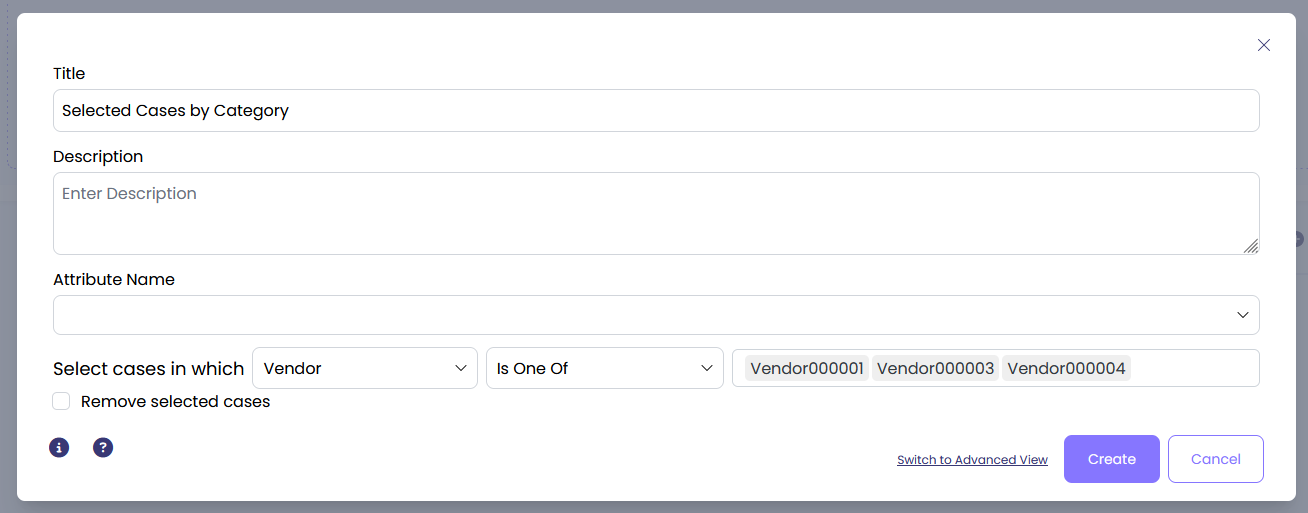
Example 2: Late Deliveries #
To see how many deliveries were late by more than 1day, depending on item name, use the following settings:
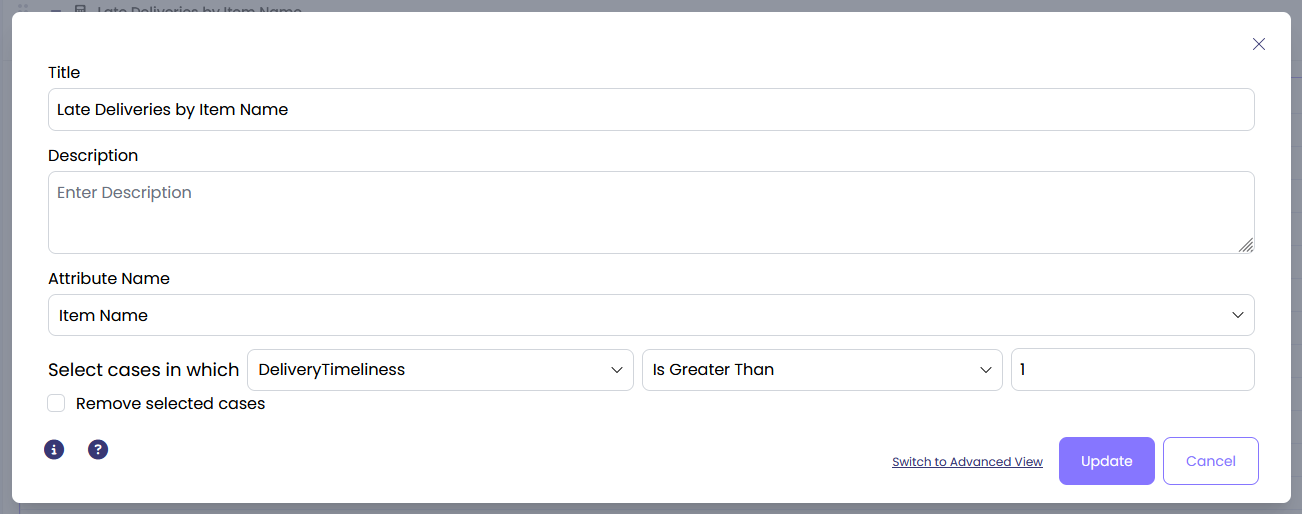
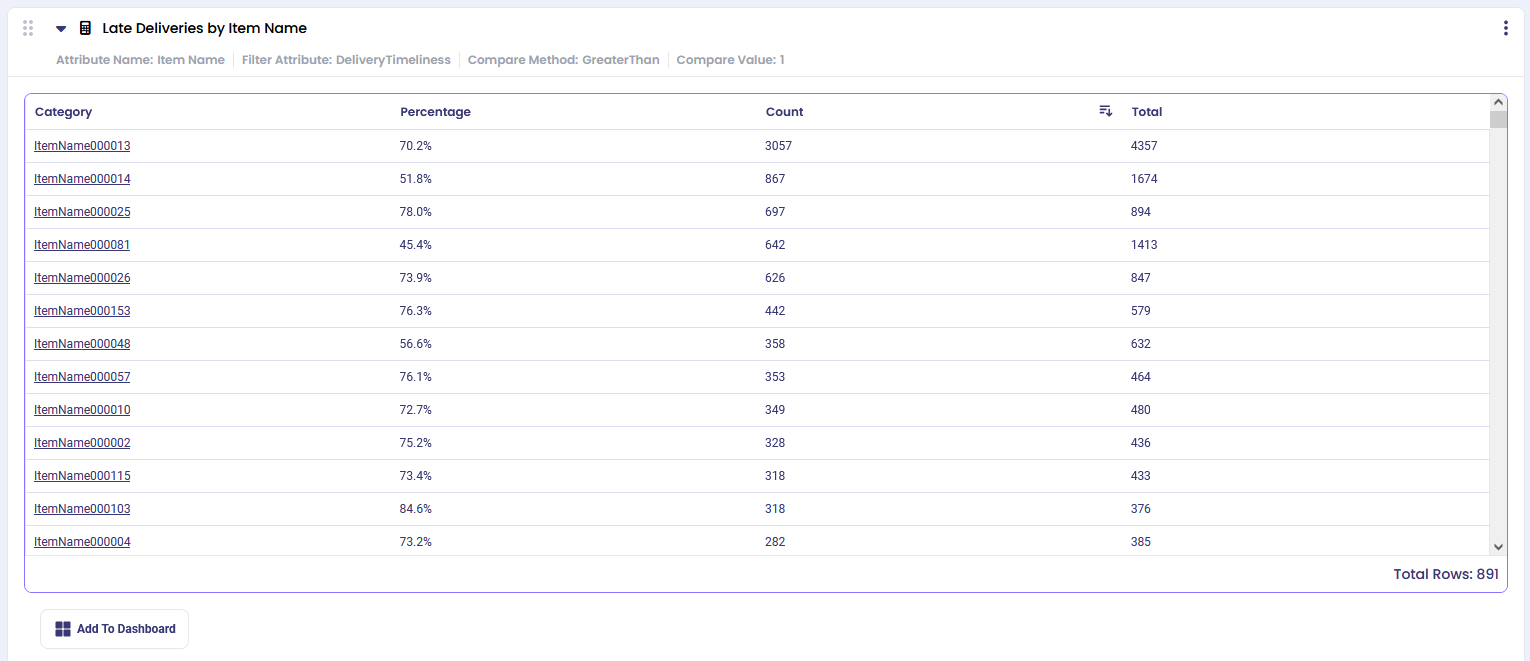
The output shows the percentage of late deliveries broken down by item name. Sort by ‘Count’ to see items with most number of late deliveries first.
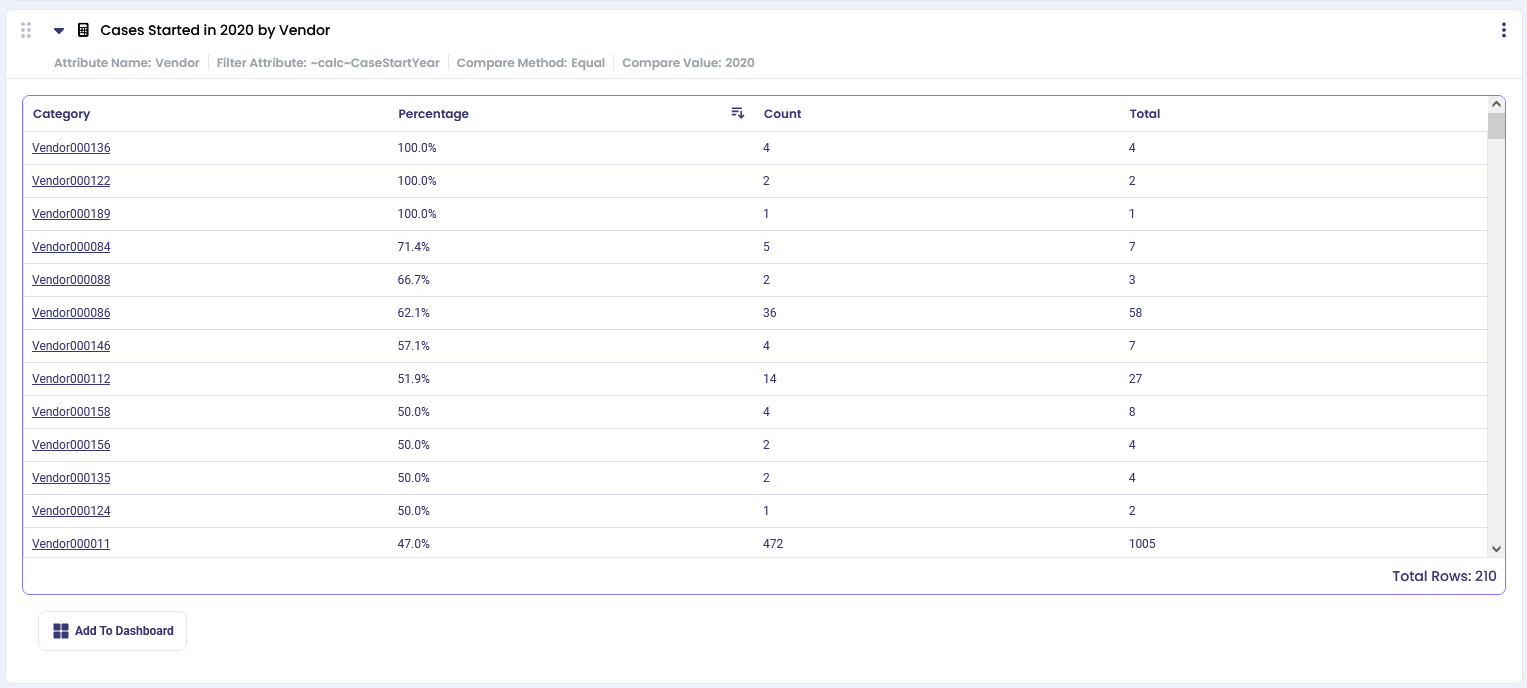
Example 3: Cases Started in 2020 #
To see how many cases were started in 2020 for each of the vendors, use the following settings:
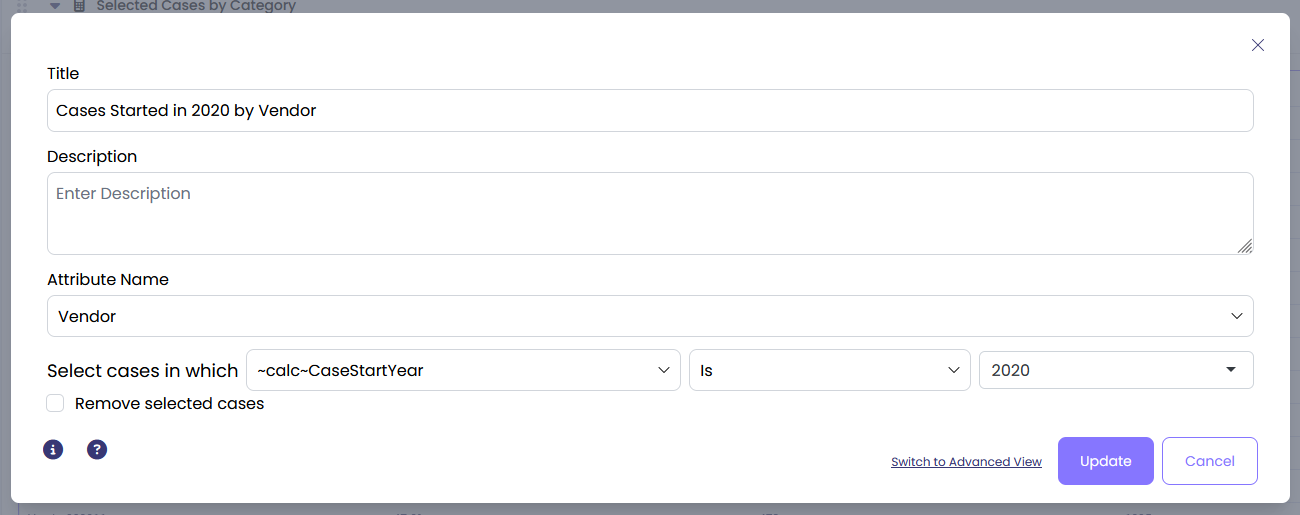
If we filter the output by ‘Percentage’, we will see several vendors with 100% meaning their cases only started in 2020 and not during any other years.